
Covid: Twelve charts on how Covid changed our lives
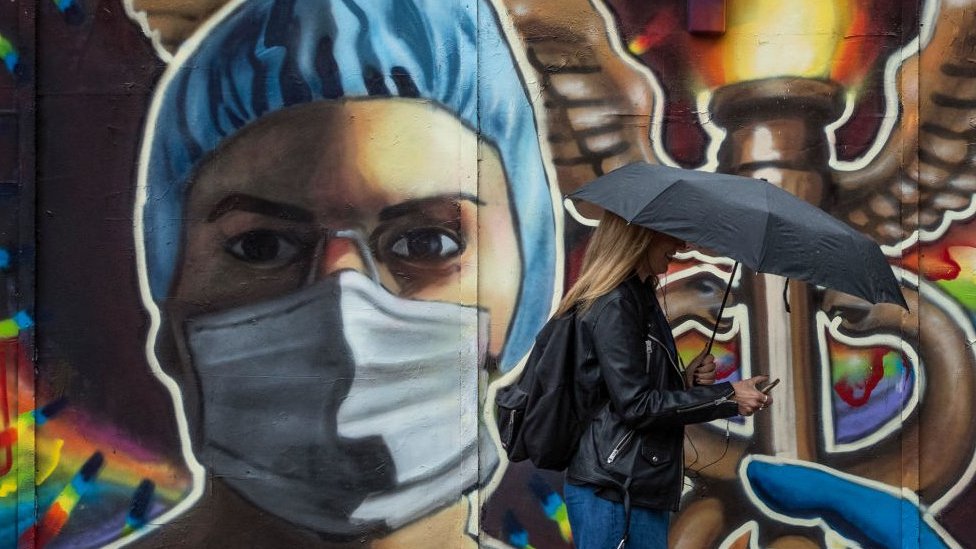
Getty Images
Life has changed dramatically since the start of the coronavirus pandemic. There has been an enormous human and financial cost – and its impact has also been felt in many other ways.
Four of our correspondents look at the impact of the pandemic in numbers – from cancelled operations to school days lost and a rises in benefit claimants.
Health and the NHS: Backlogs and thousands of deaths

The most reliable way
to measure the impact of coronavirus is to see how many people have died, and how much that figure is above the usual annual total.
Between March and the end of November, there were more than 77,000 excess deaths above the five-year average, which were almost exclusively driven by Covid.
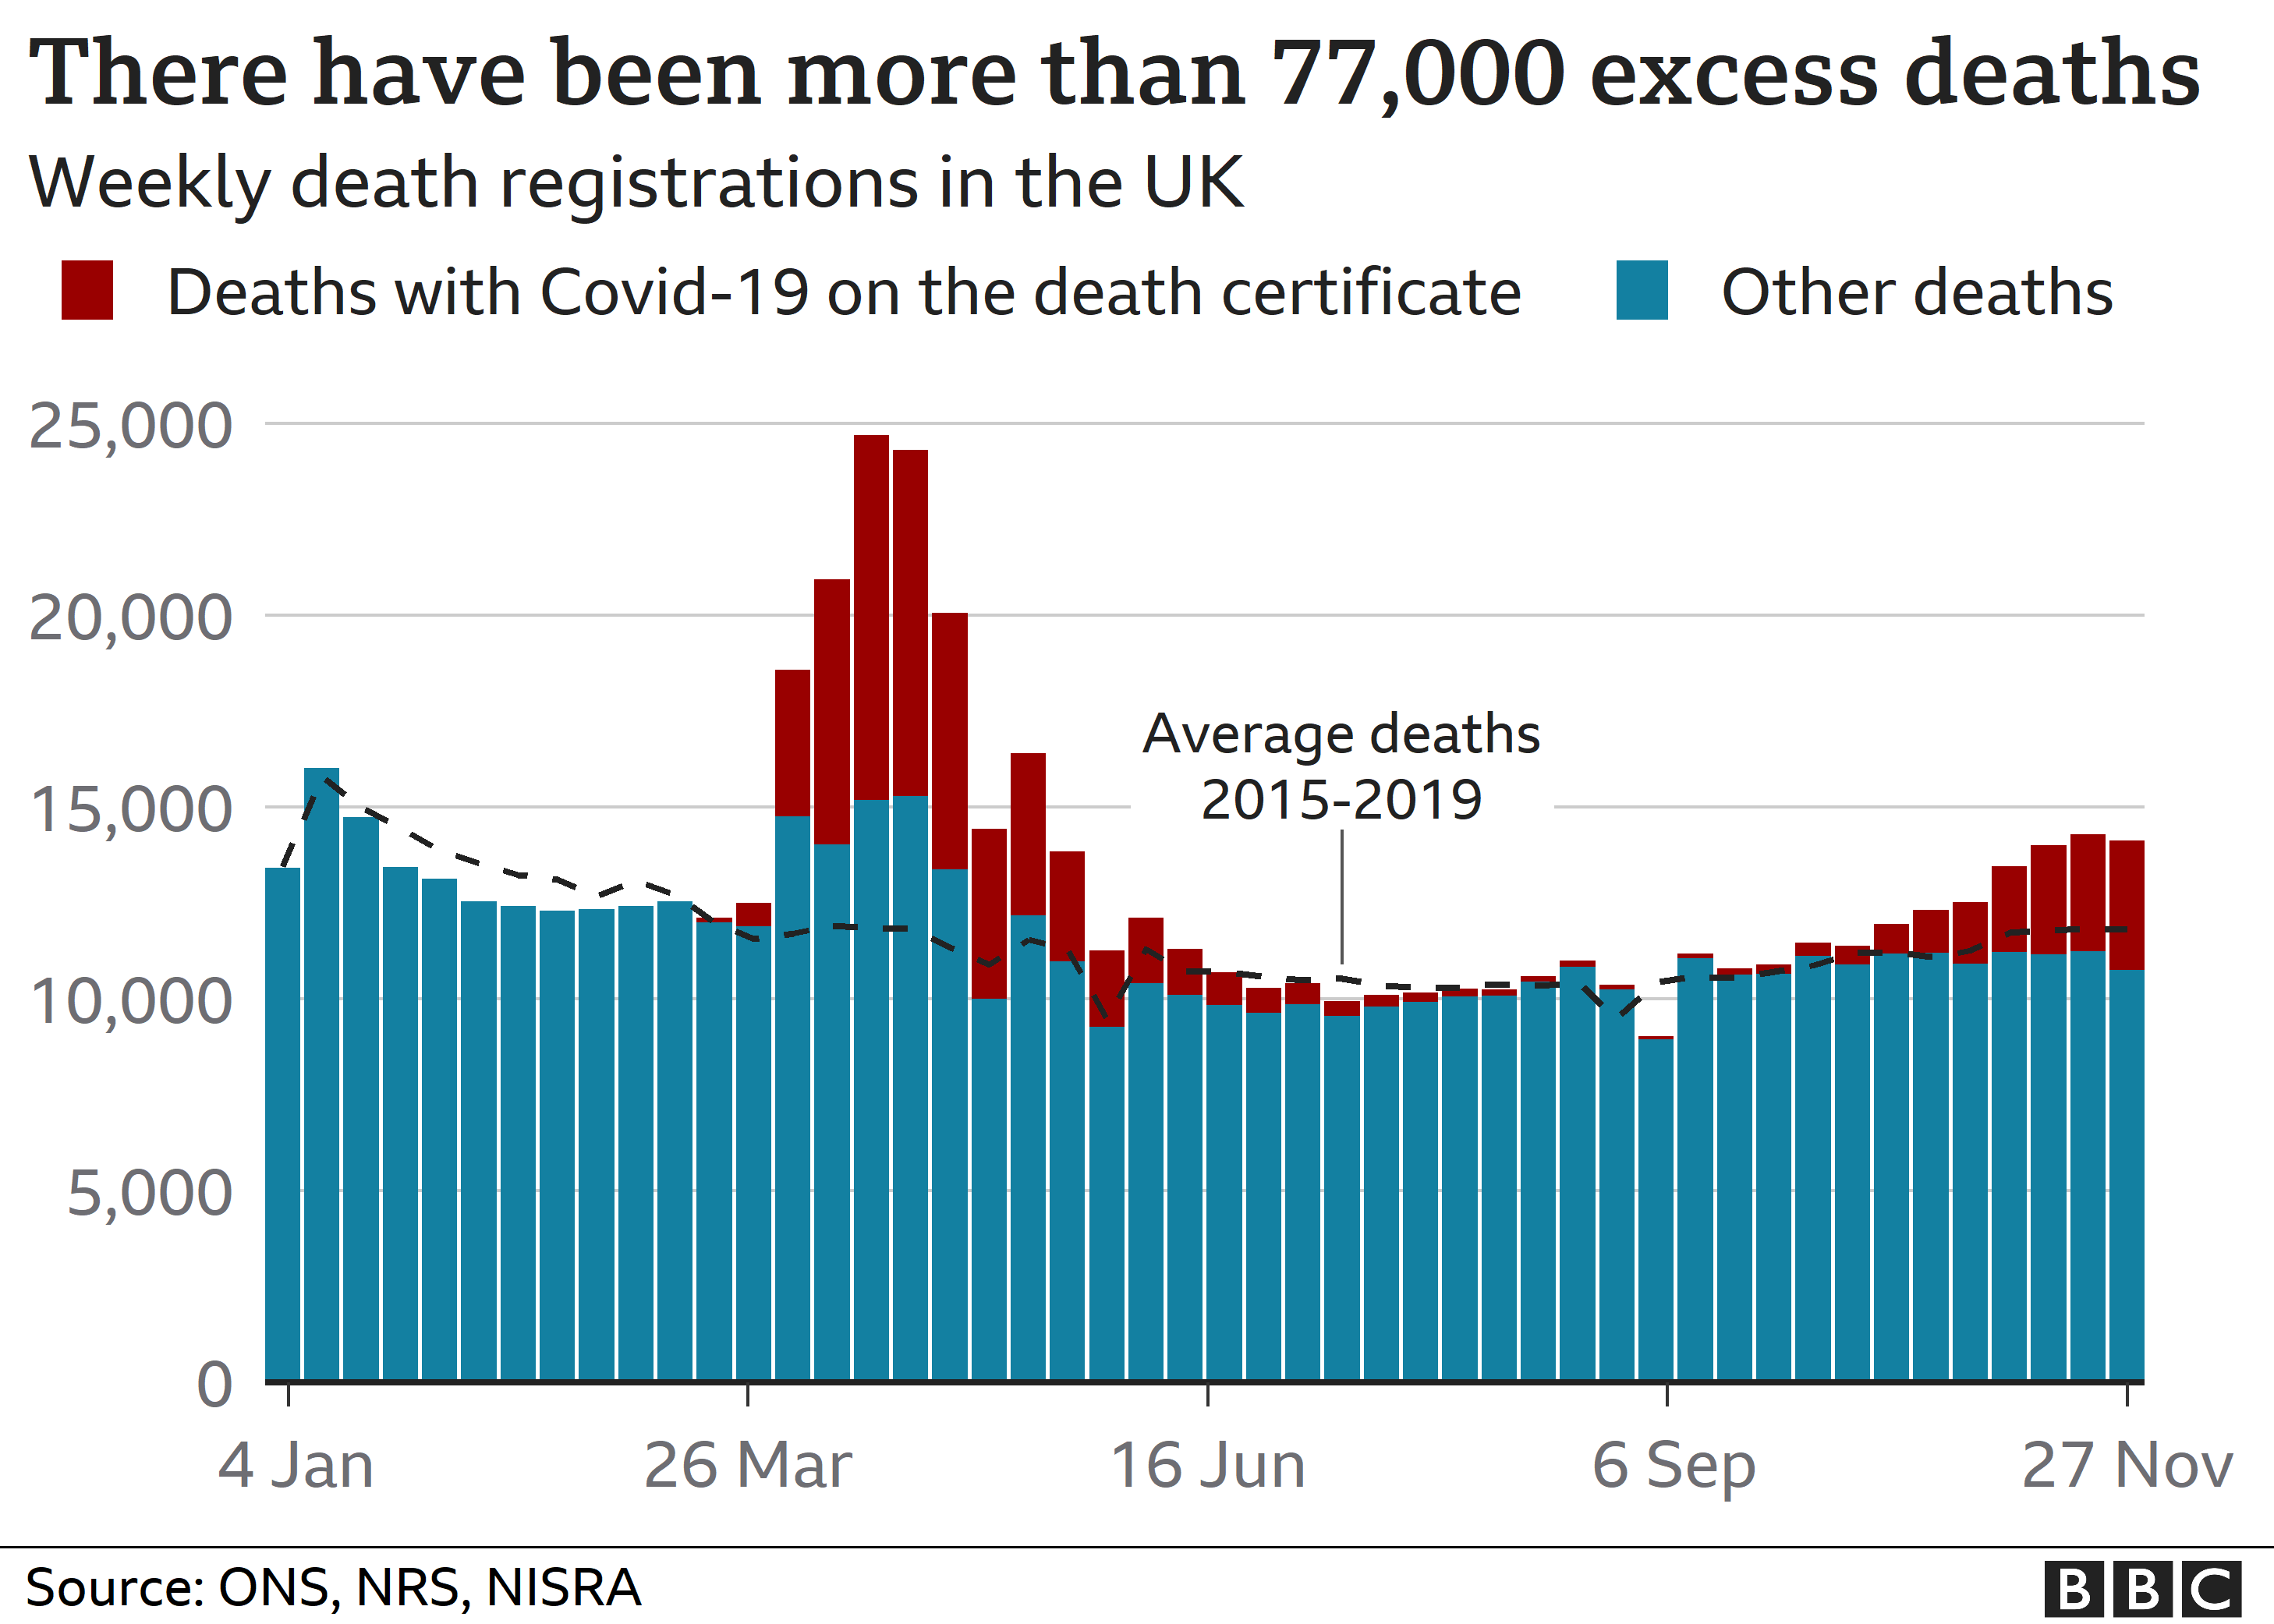
Not every death linked to Covid is a death that was directly caused by it. But Office for National Statistics analysis shows close to nine in 10 cases in England and Wales have been.
And deaths among younger age groups have been relatively rare. There are no excess Covid deaths in the under-45s, because the majority of people who have died have been among older age groups. The average age of death is over 80.
- How deadly is the coronavirus?
- Coronavirus: What is the risk to men over 50?
Neither have deaths been evenly distributed across the country.
London saw a surge in cases first, followed by the north of England, with leaders there suggesting that the first lockdown was lifted too early for them. Now, there are signs the south of England’s second wave is growing as the North’s recedes.
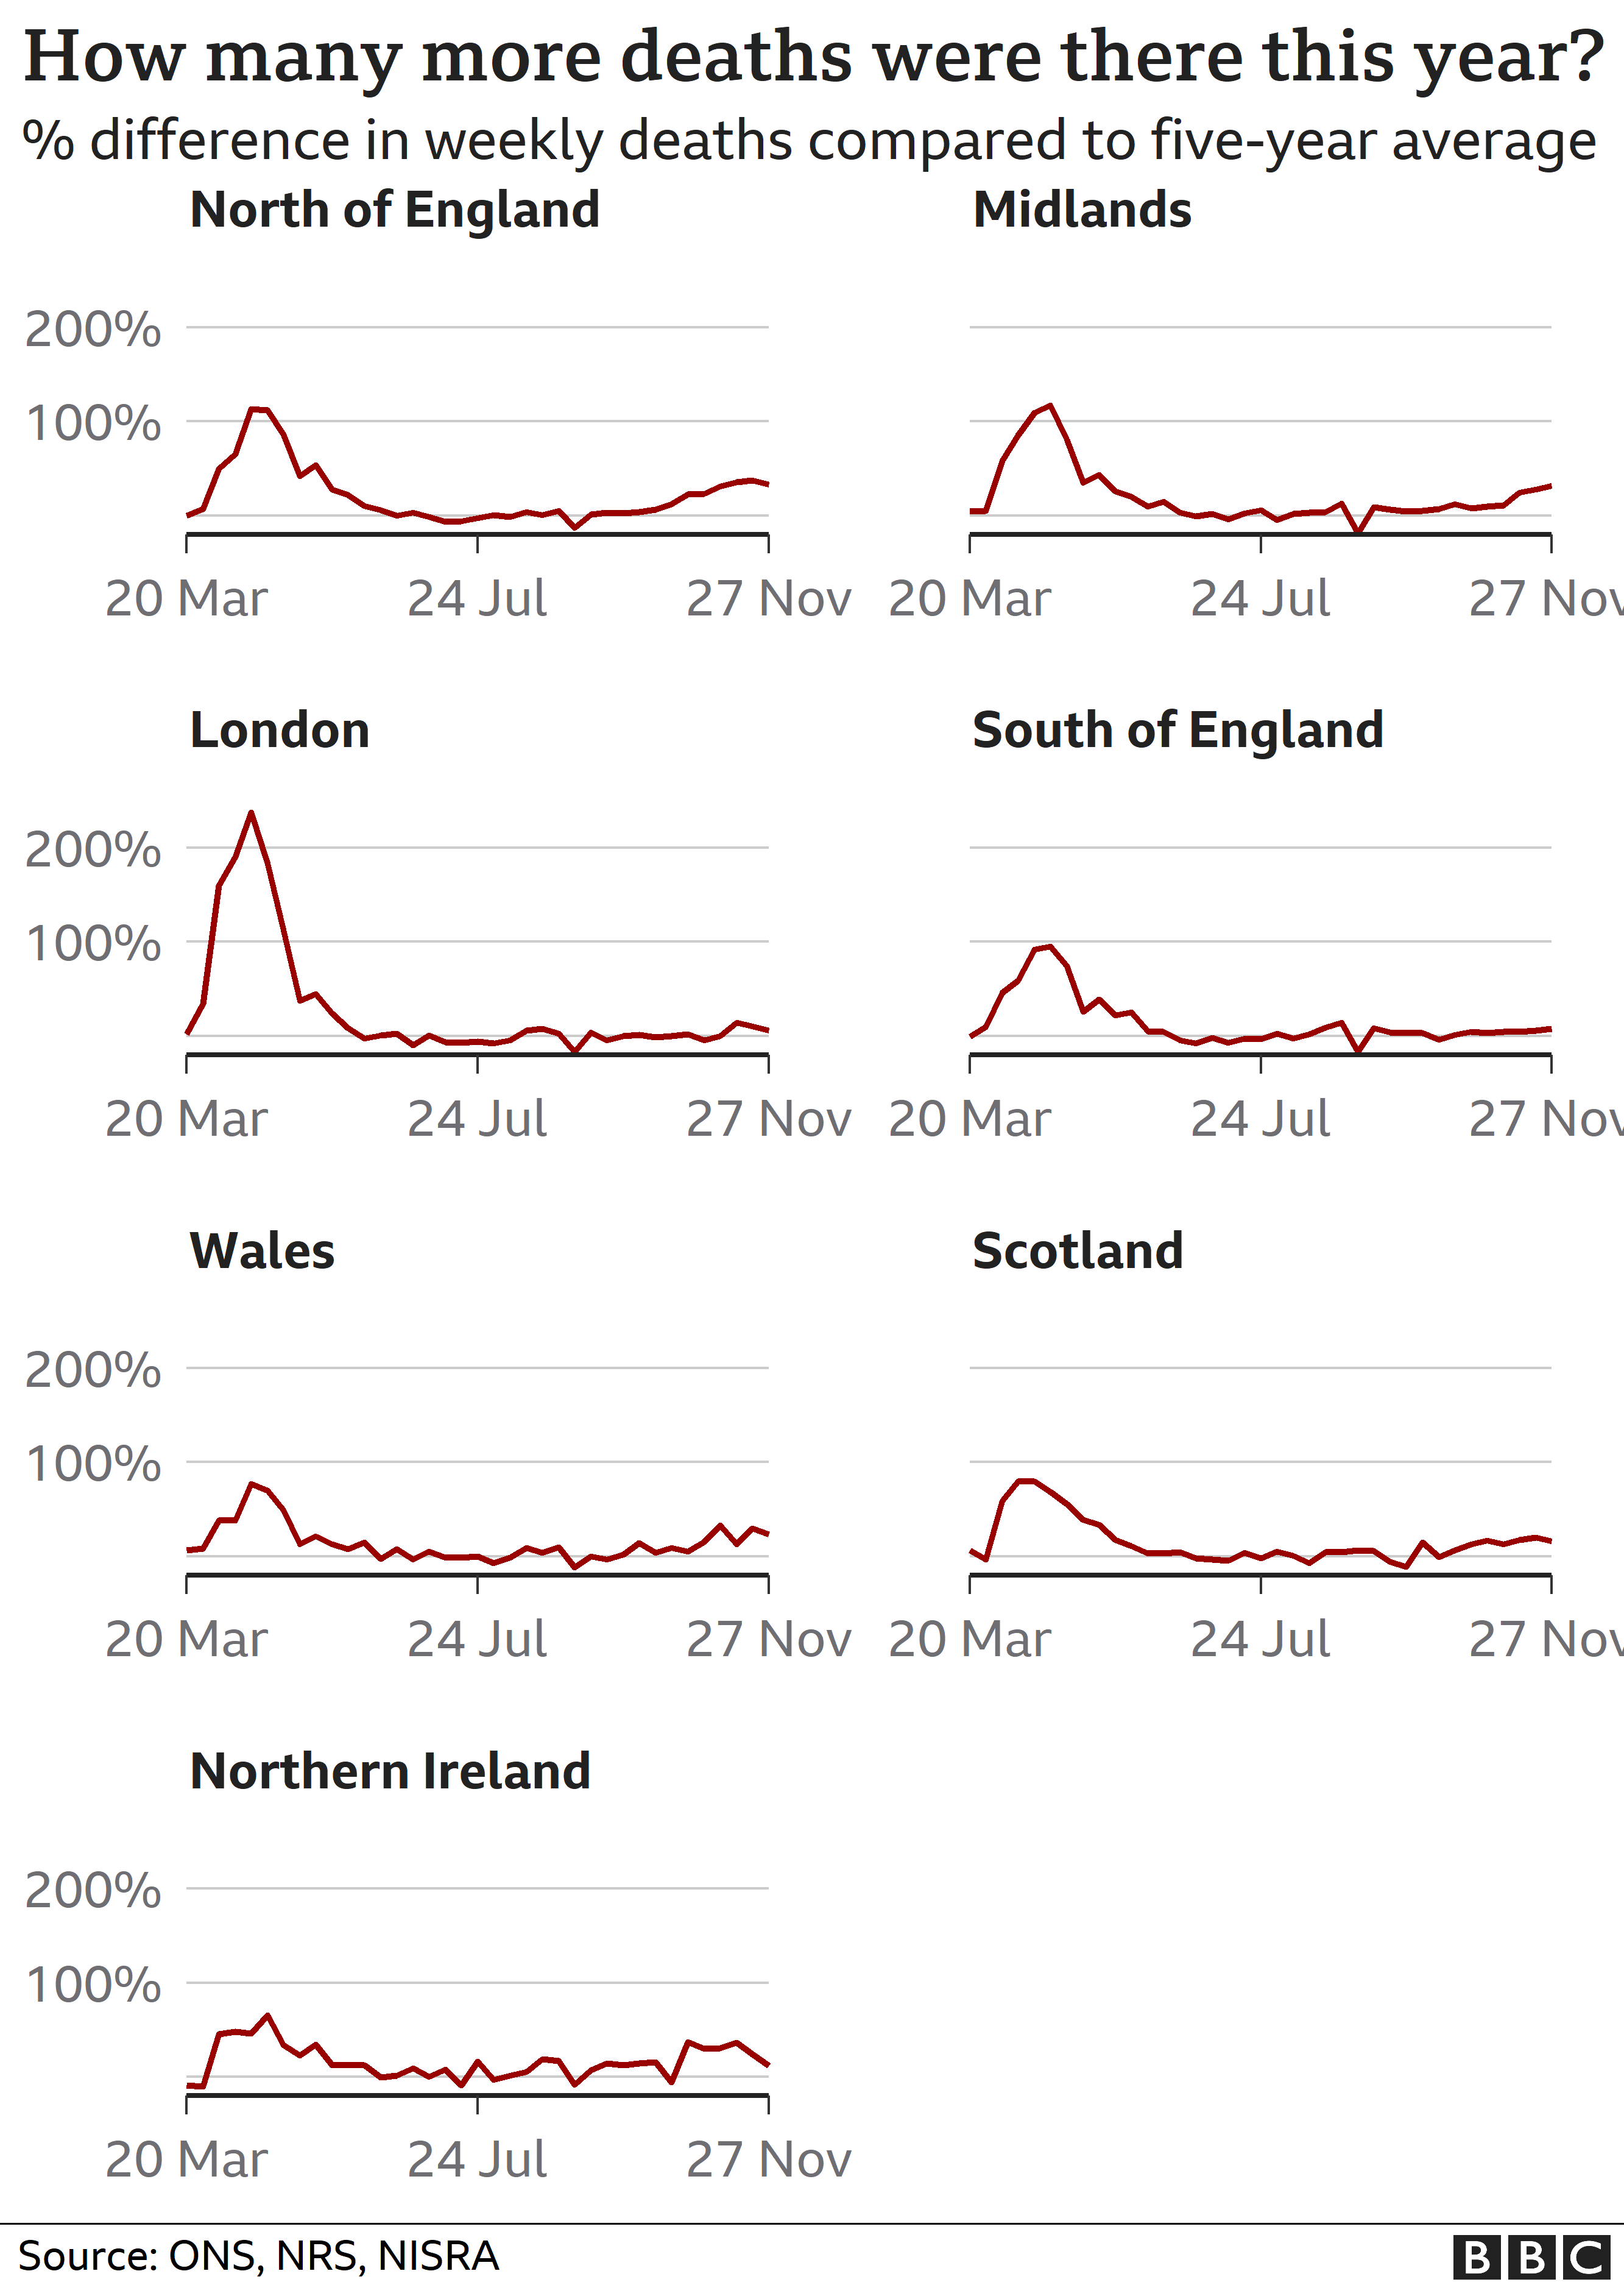
But slice this data up even further and distinct patterns emerge. People from poorer backgrounds and those from ethnic minorities are both at a significantly higher risk of death.
- Why are more BAME people dying from coronavirus?
- Deprived areas hit twice as hard by coronavirus
- Why is so much of the North and Midlands in the top tier?
There are several complex factors at play, with people from these communities more likely to:
- Work in jobs where they see the public
- Live in densely-populated housing
- Have poorer health, with conditions like diabetes, heart disease, obesity and respiratory problems all more common
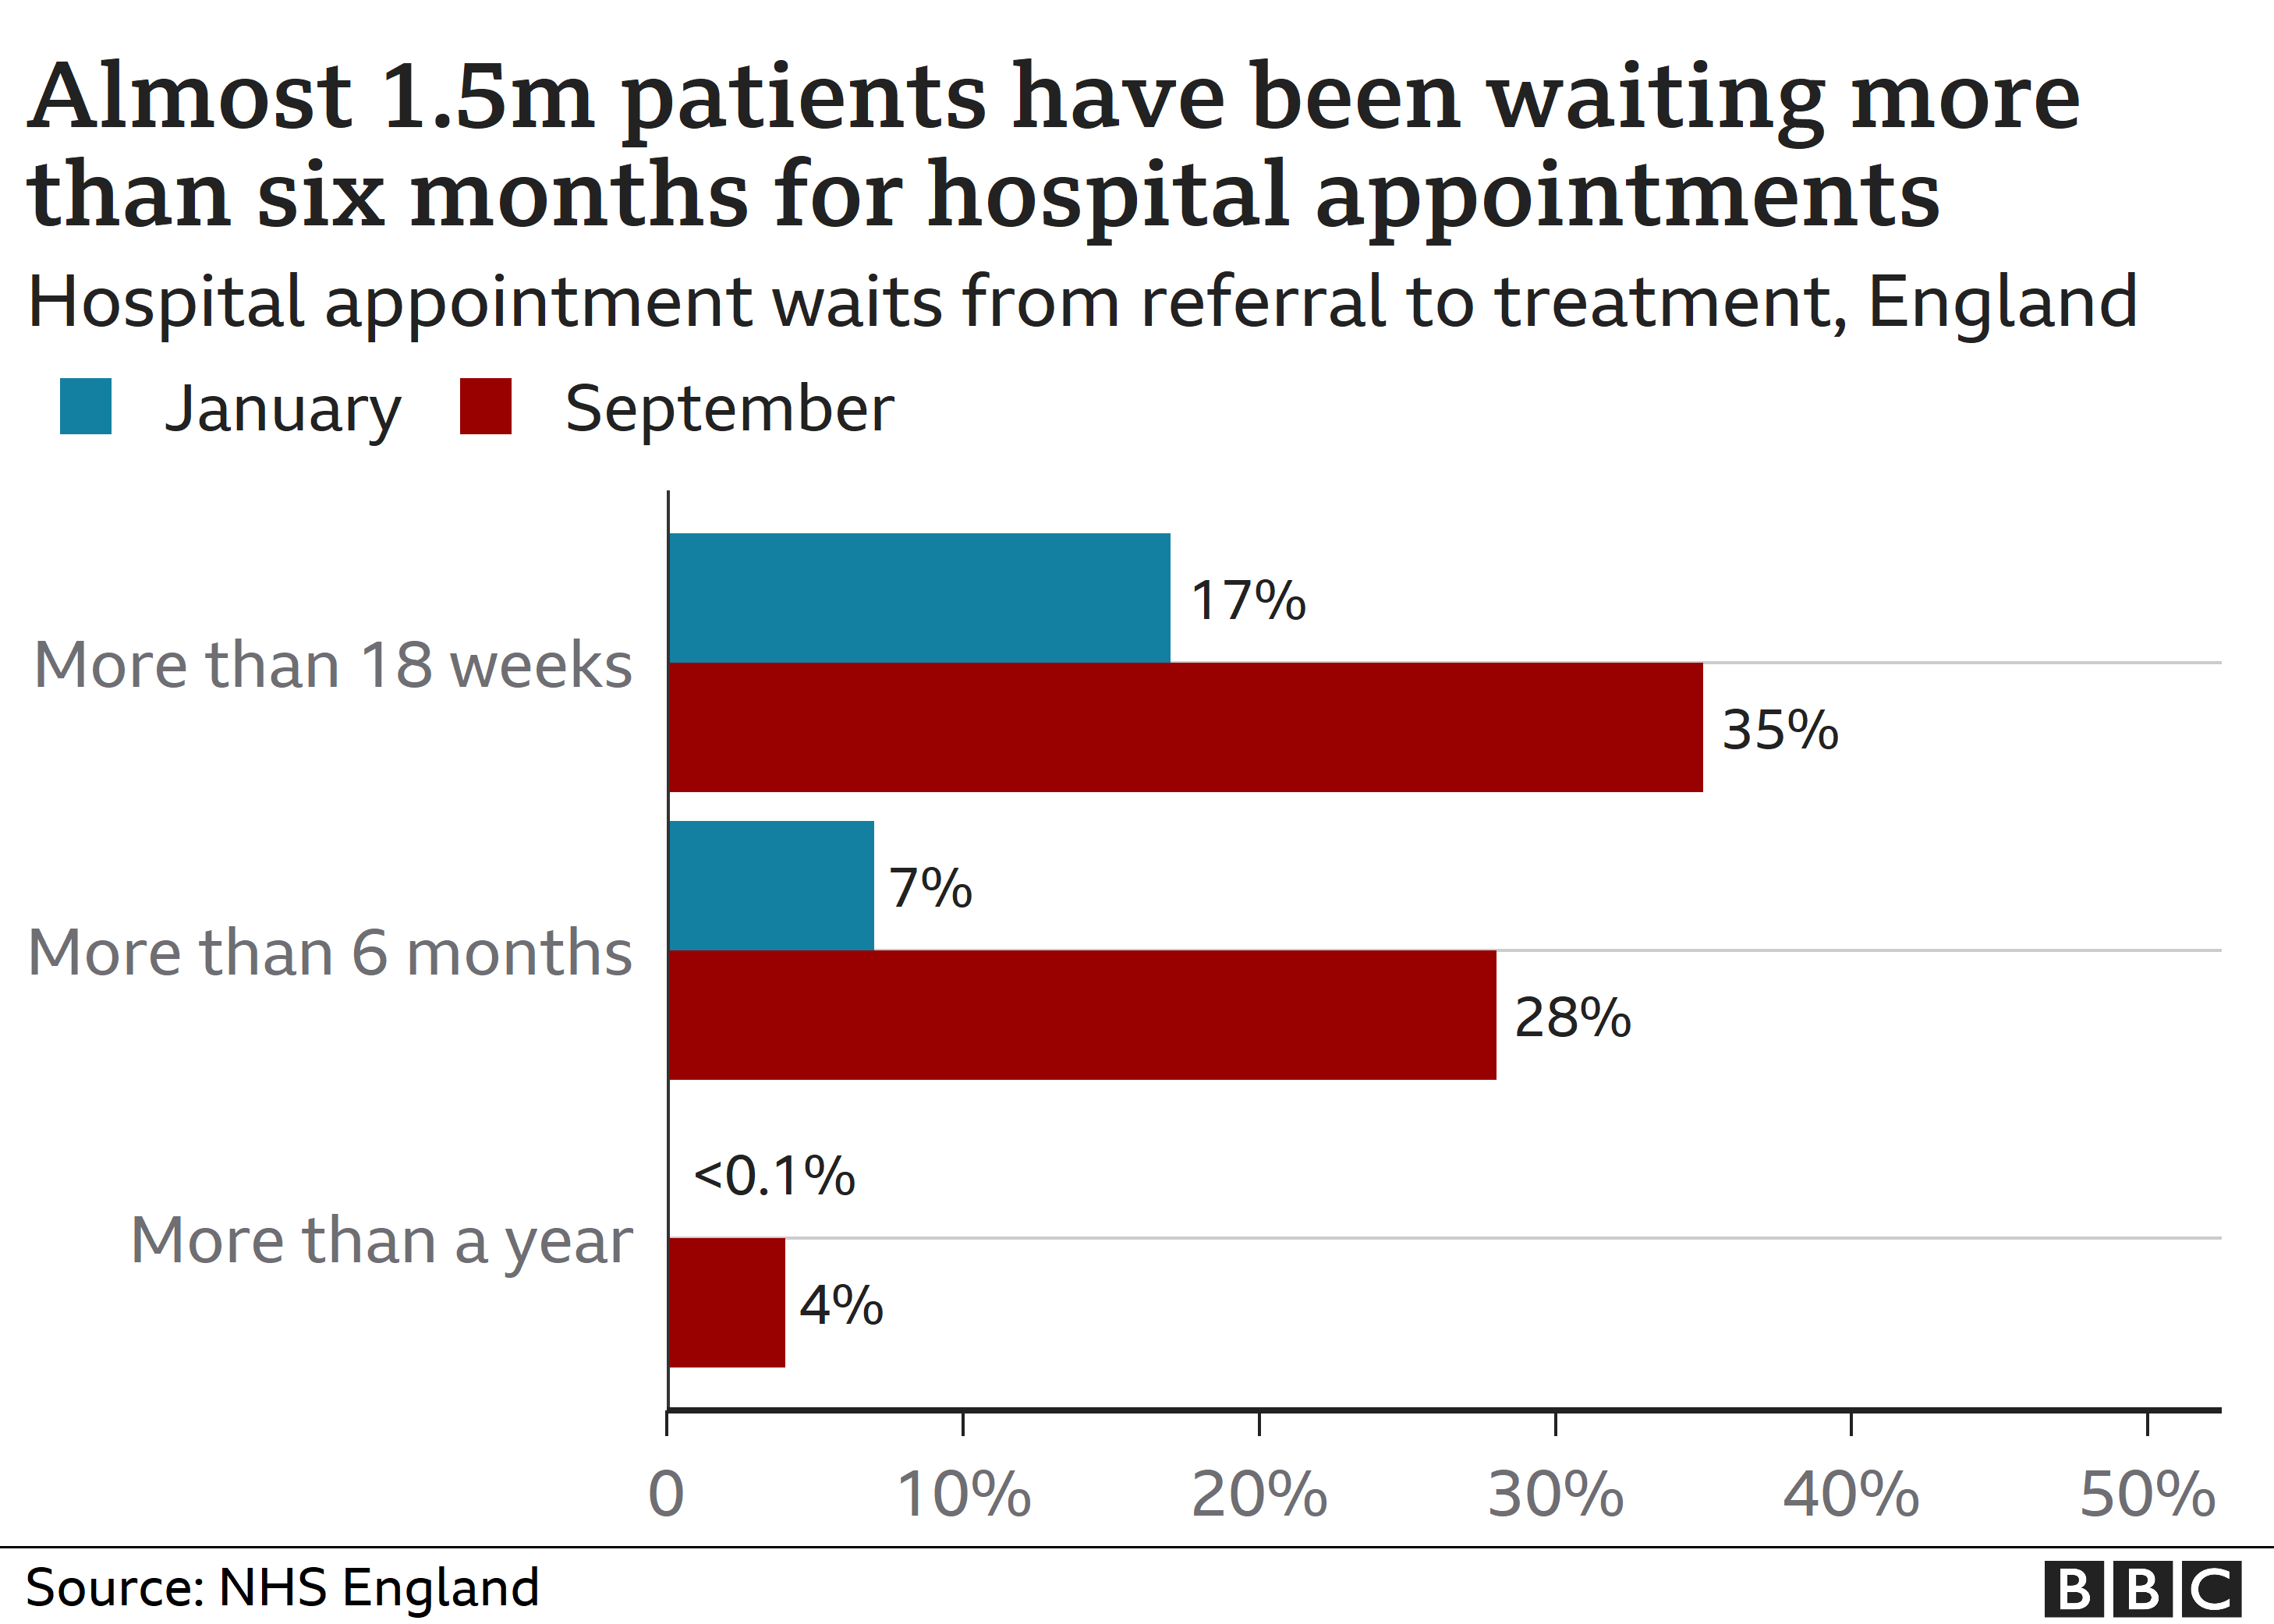
Covid has also disrupted other NHS services, with warnings about people not getting treatment or diagnosis for other conditions.
Routine work, including knee and hip replacements, was cancelled in the spring, leading to a growing backlog and more people facing long waits.
Cancer services were severely disrupted and activity levels have only recently returned to normal. Macmillan Cancer Support estimates there may be as many as 50,000 missing diagnoses.
And visits to A&E have also fallen by a third since March, compared with the same time last year.
Doctors say people were worried about the Covid risk and felt they should not bother the health service. But among those not coming forward were people with the symptoms of heart attacks and minor strokes.
Law and society: Ban on mingling and court case delays

A year ago, nobody would have thought police would be telling people sunbathing it is against the law, or that “mingling” could be punished with an immediate fine of £200.
But one of Covid’s greatest costs has been the unprecedented restrictions on civil liberties in peacetime.
Across the four nations, in the rush to enforce lockdowns and other restrictions, more than 20 pieces of law have come into force that have criminalised otherwise normal behaviour. Most of them were not even debated or voted on by elected politicians.
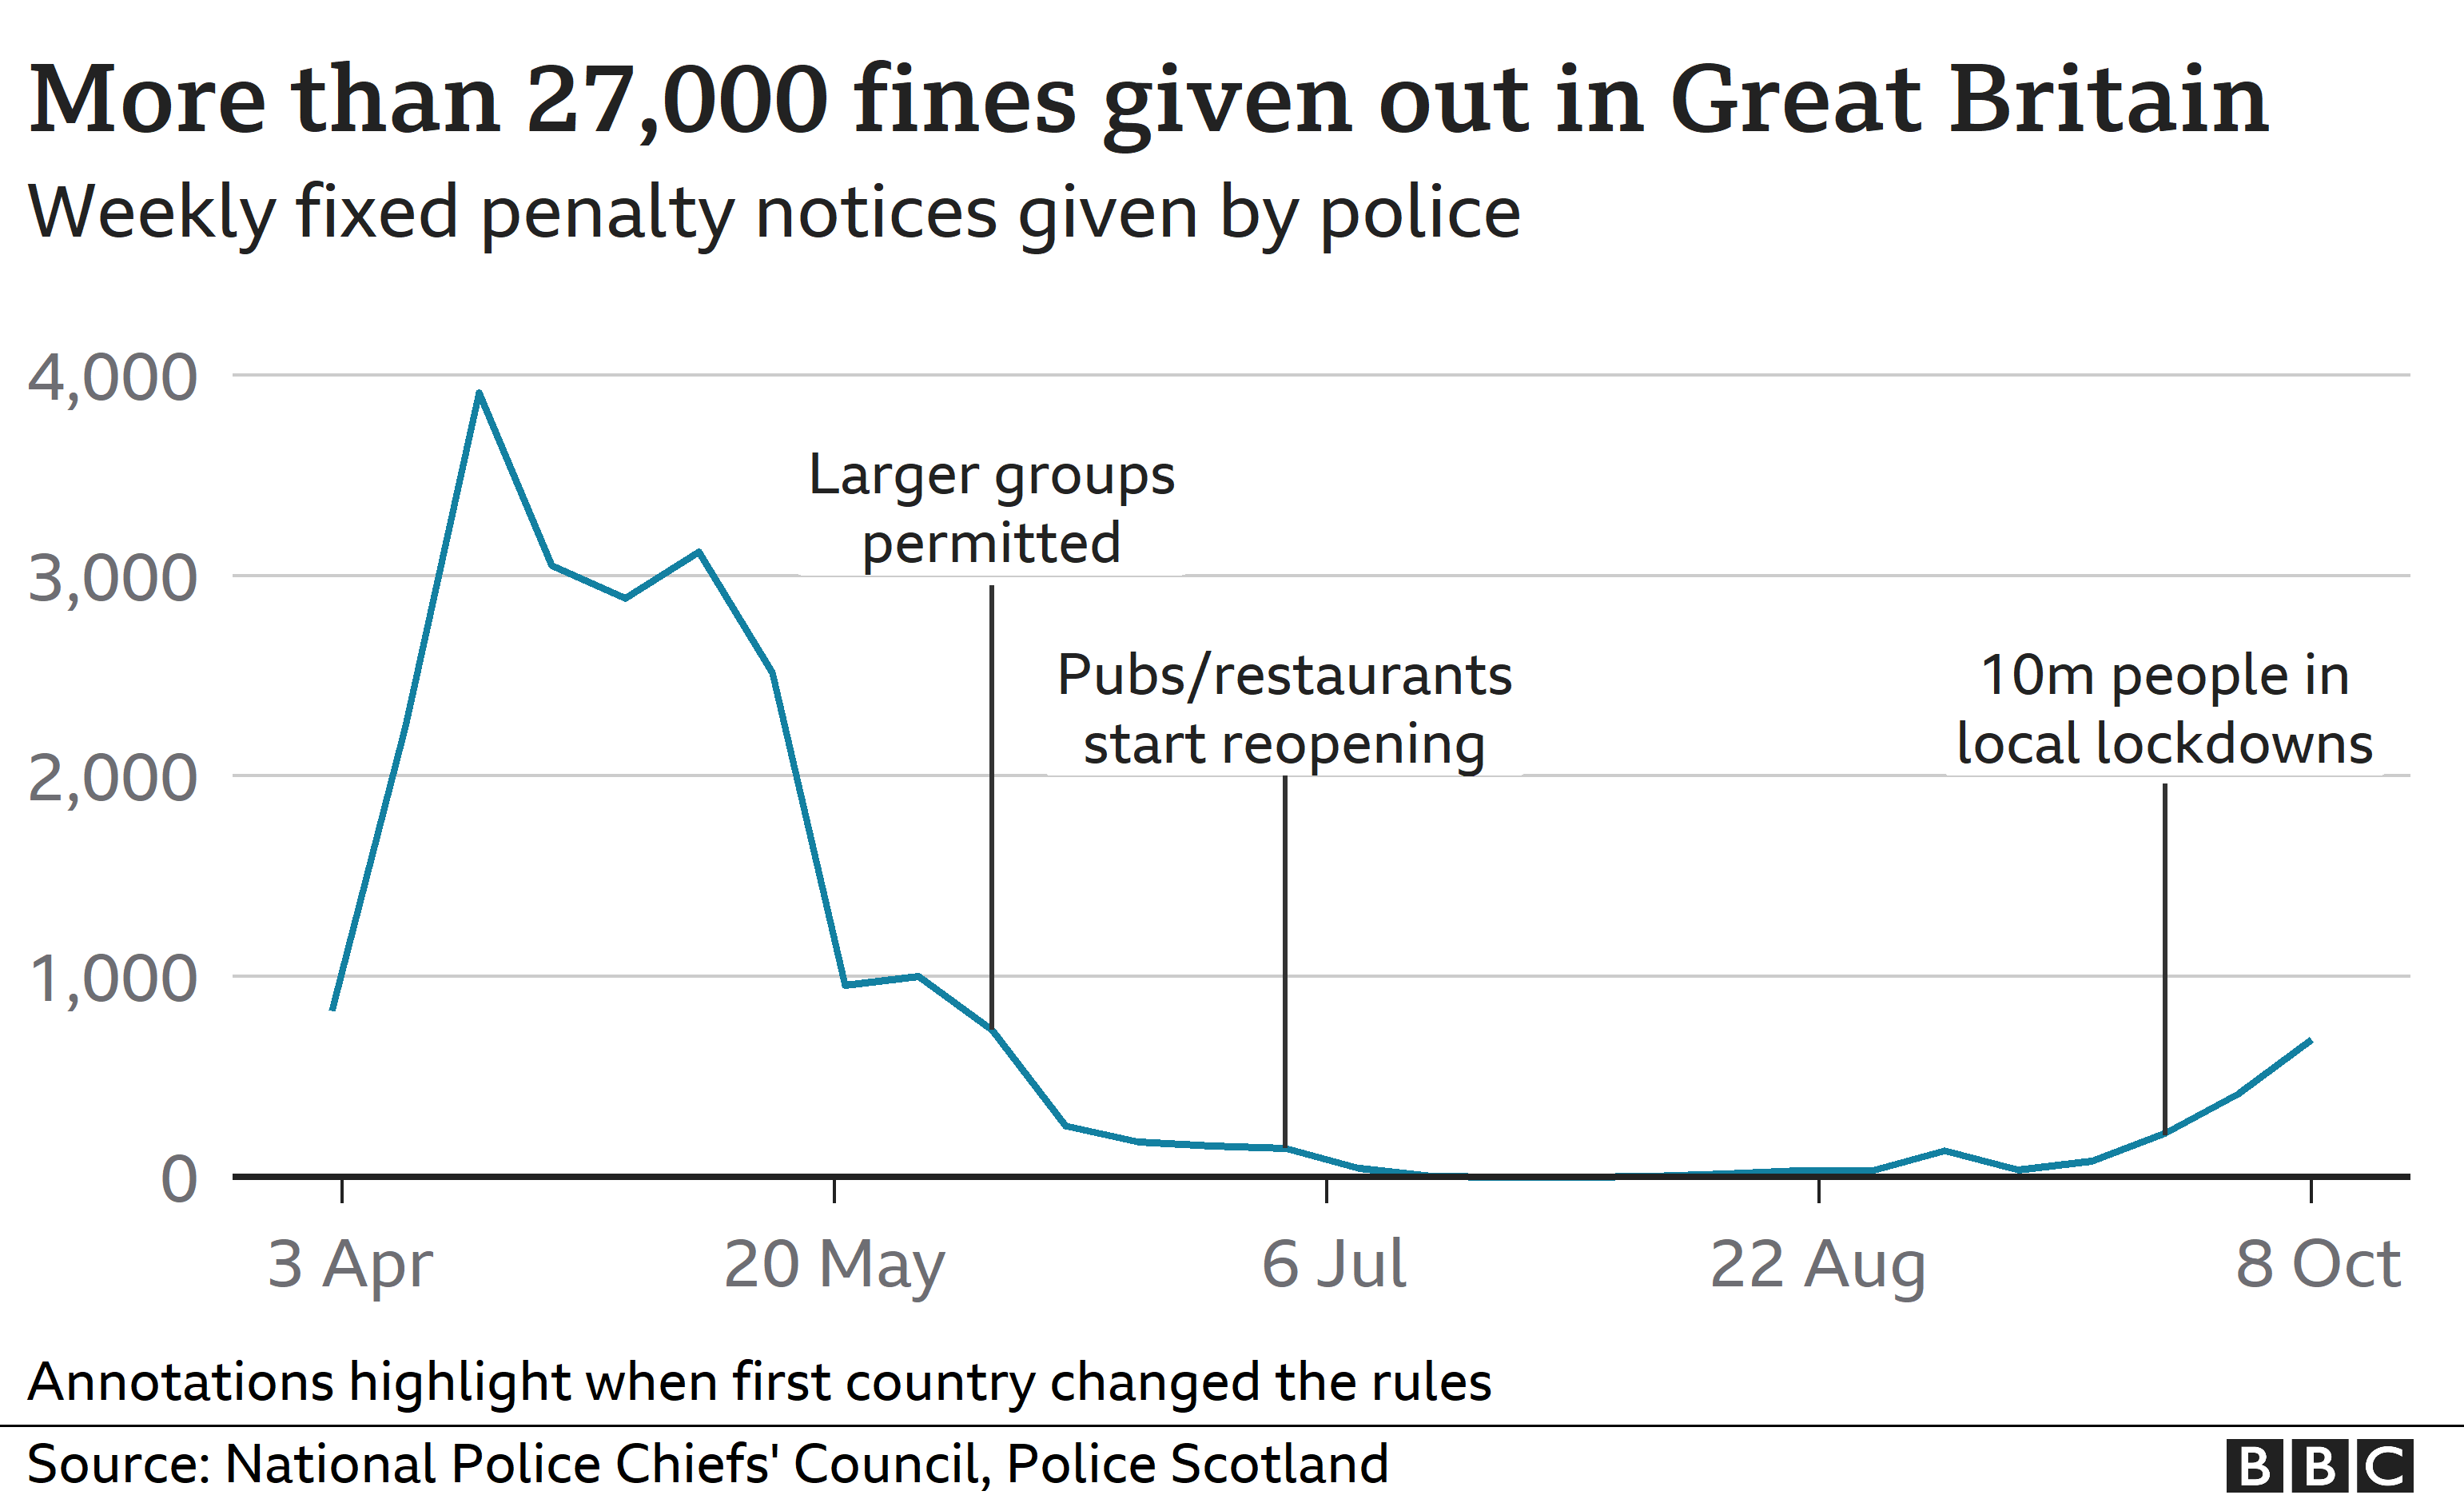
The 27,000 fines, mostly for gatherings, are not evenly spread geographically.
Leicester has been under the longest-standing restrictions – yet it has a far lower rate of fines than north-west England which has faced similar challenges.
Some of that is down to local policing decisions – not least because many officers are very wary of the long-term impact on community relations if they continually dish out fines.
The backlog in the courts is enormous. So much so that there are people now waiting for trial in England, for alleged offences committed in 2018, who may not face a jury until 2022.
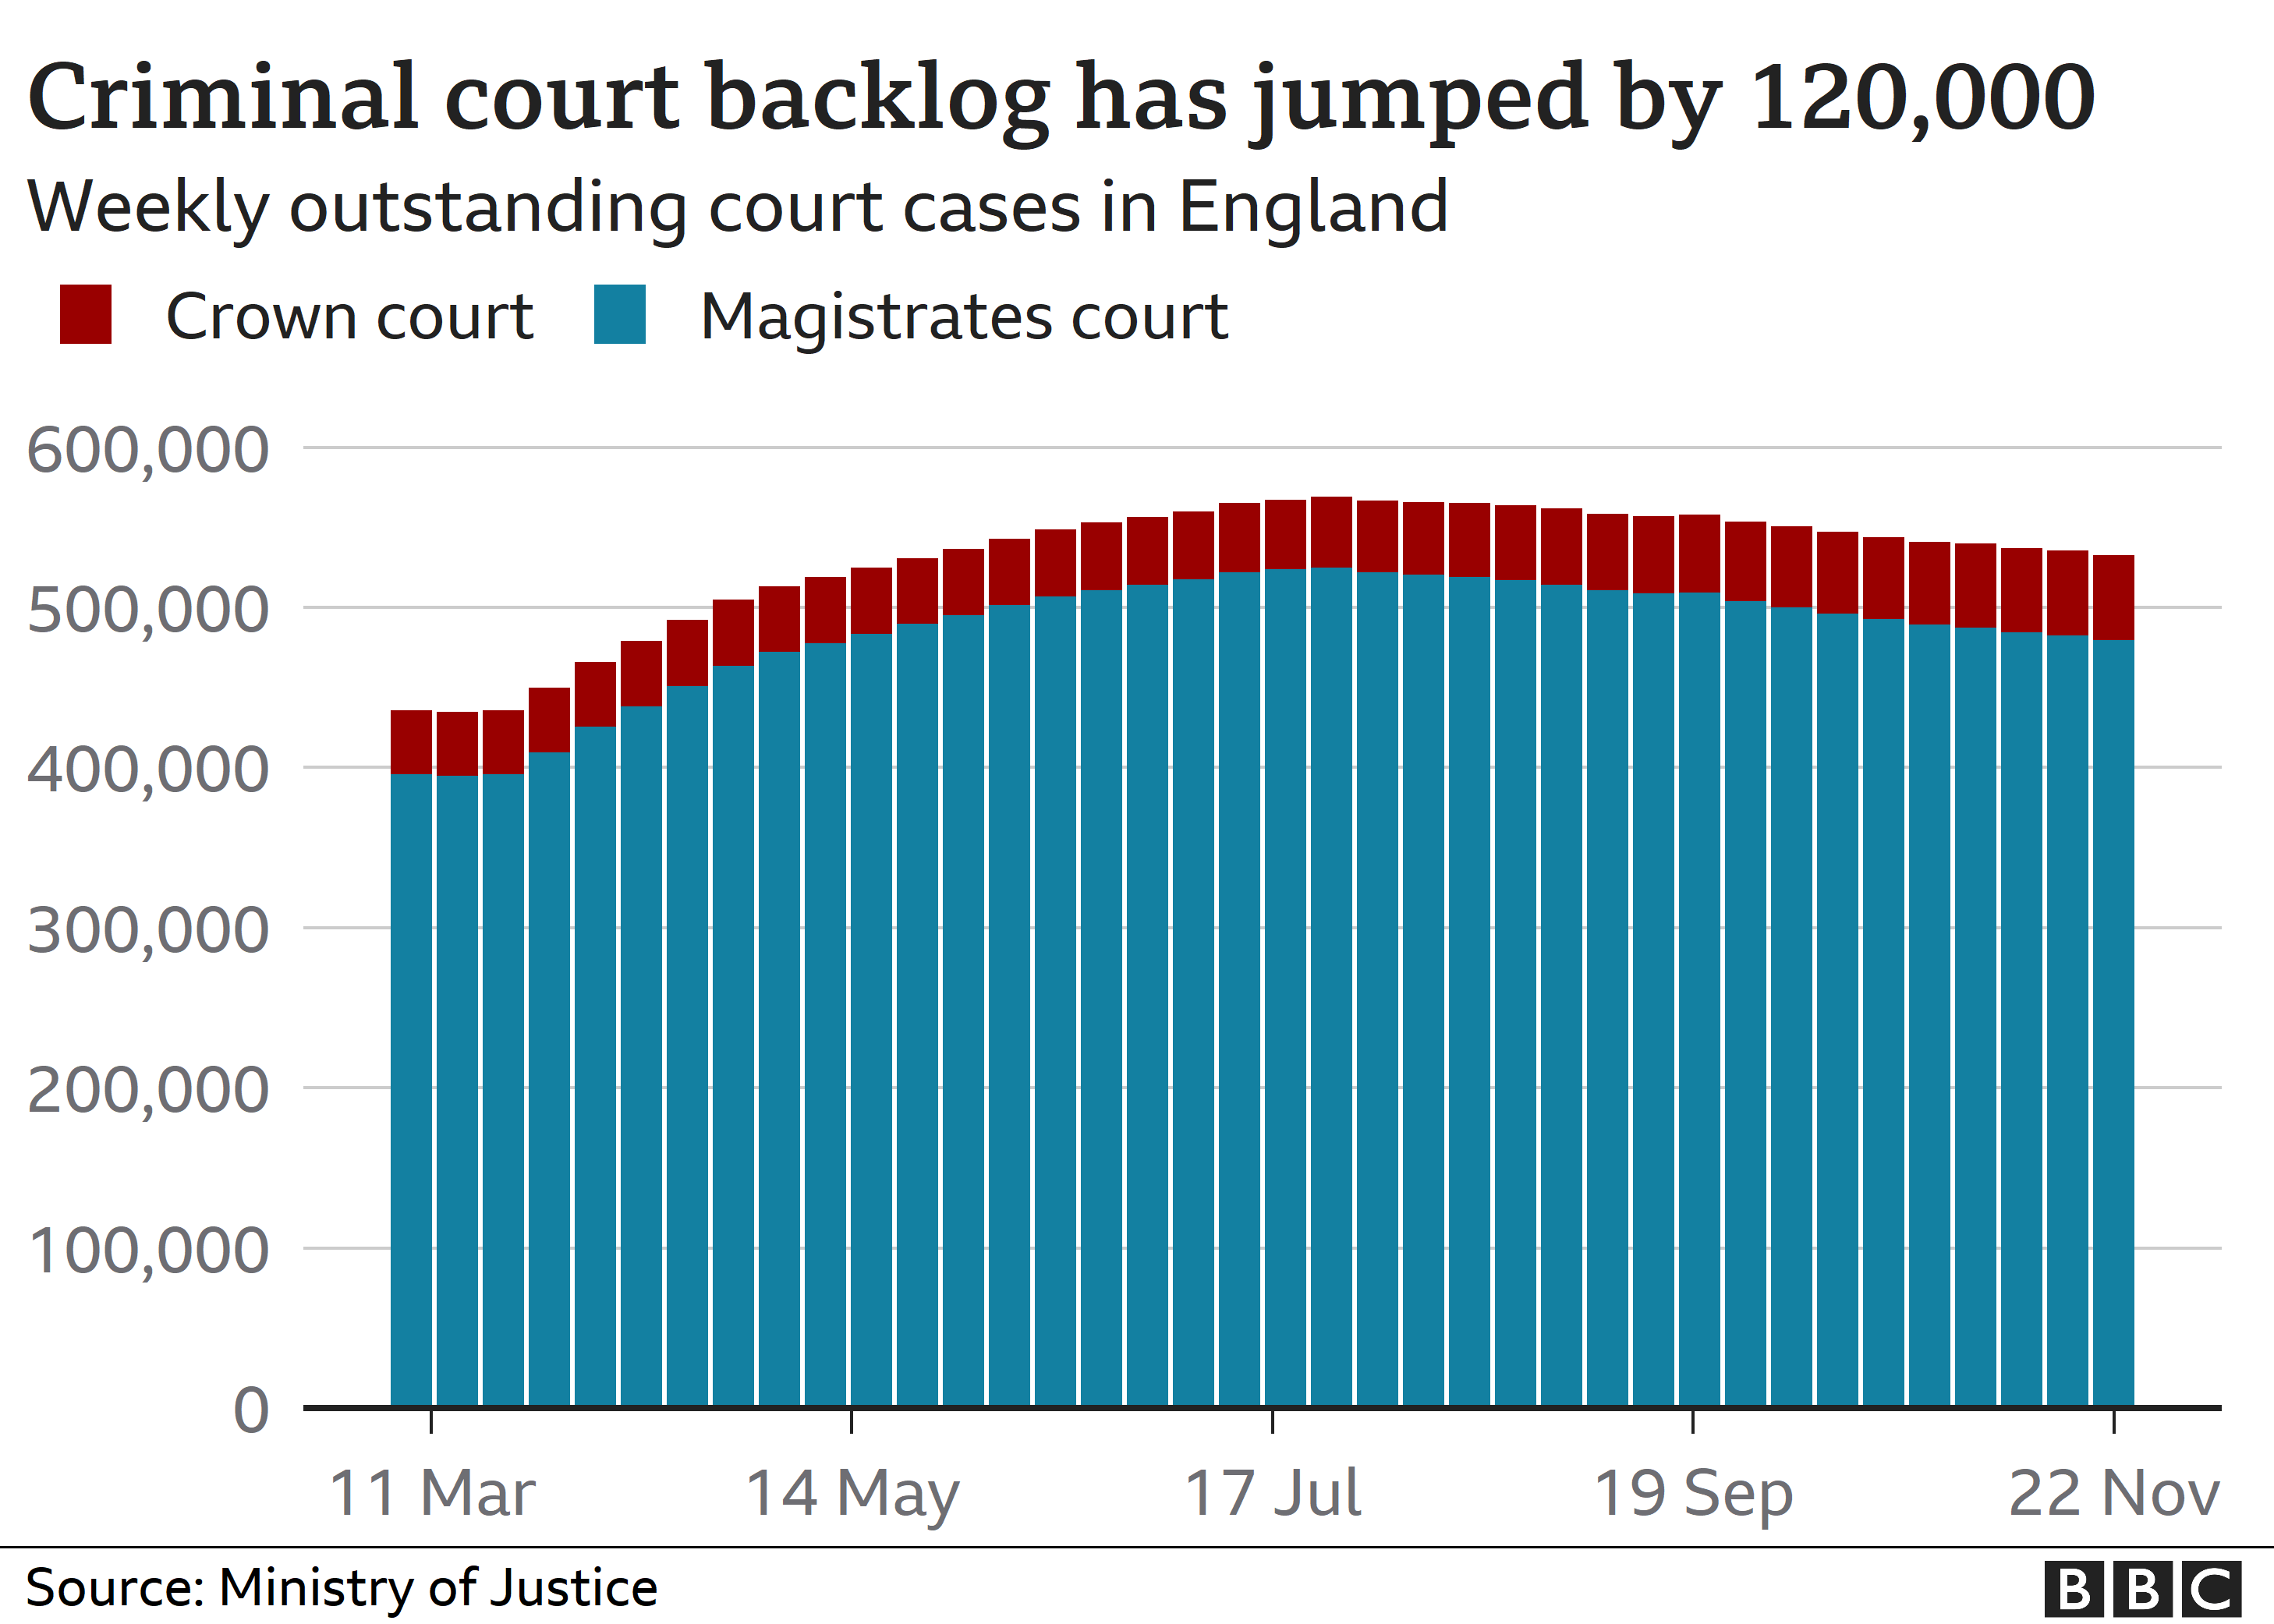
When the pandemic hit, jury trials were stopped because the courts could not guarantee safe distancing to prevent the risk of the virus spreading.
Crest, a crime and justice consultancy, estimates that unless capacity doubles, the backlog of crown court cases, the most serious ones, will be near 200,000 by 2024.
The Lord Chief Justice hopes to have 300 crown courts sitting by the new year – but that will still be less than the maximum possible.
But these enormous delays to justice – affecting defendants, victims and witnesses – are not just down to Covid. England and Wales already had an enormous case backlog because the government had cut the number of days judges could sit.
The Ministry of Justice says it is funding 40 additional court rooms – dubbed Nightingale Courts – to help tackle the impact of Covid to family, civil and criminal cases.
Education and family: Closed schools and mental health issues

Schools act as a place of safety and routine for children, providing a structure and certainty to their lives. That has been turned upside down in 2020, with schooling closed then repeatedly interrupted by self-isolation in the autumn term.
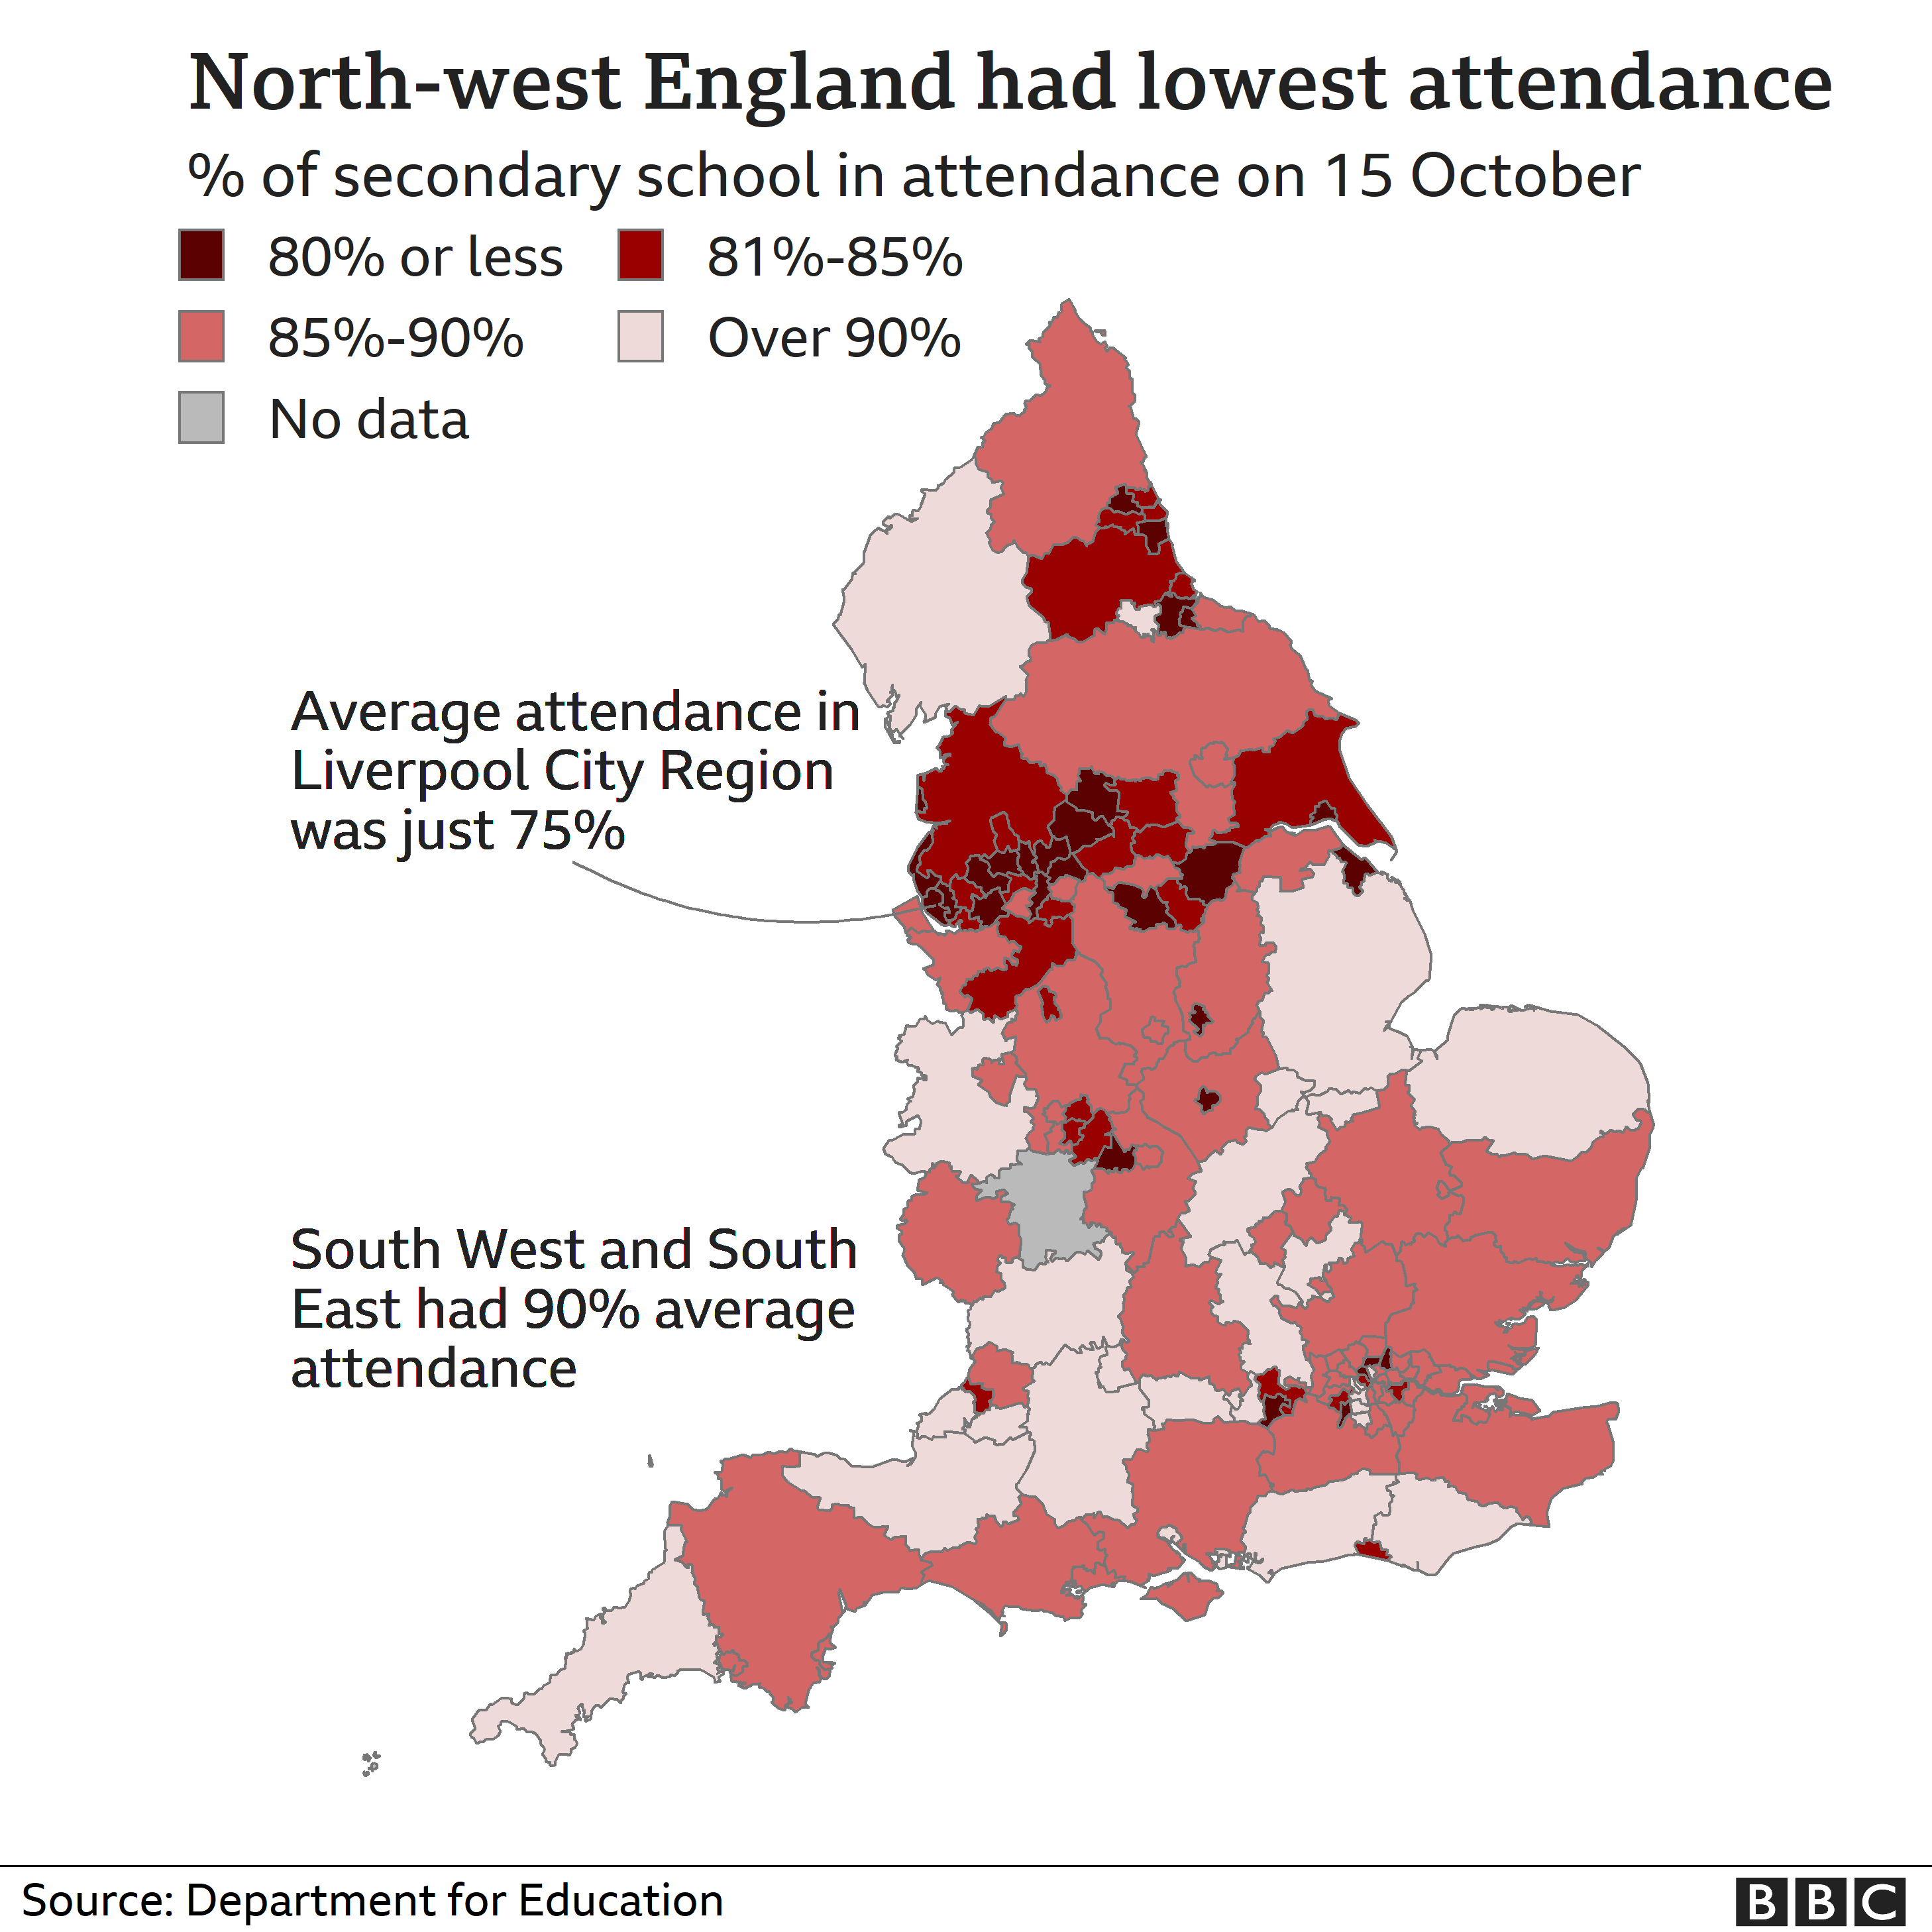
The headline national figures for secondary attendance have declined, but they don’t capture the huge geographical variations in England.
In mid-October it fell to 61% in Knowsley on Merseyside, and in early December in Kent’s Medway towns, only 42% of pupils were learning in the classroom at one point.
The loss of learning and confidence is hard to capture, but will ripple through the education system for many years.
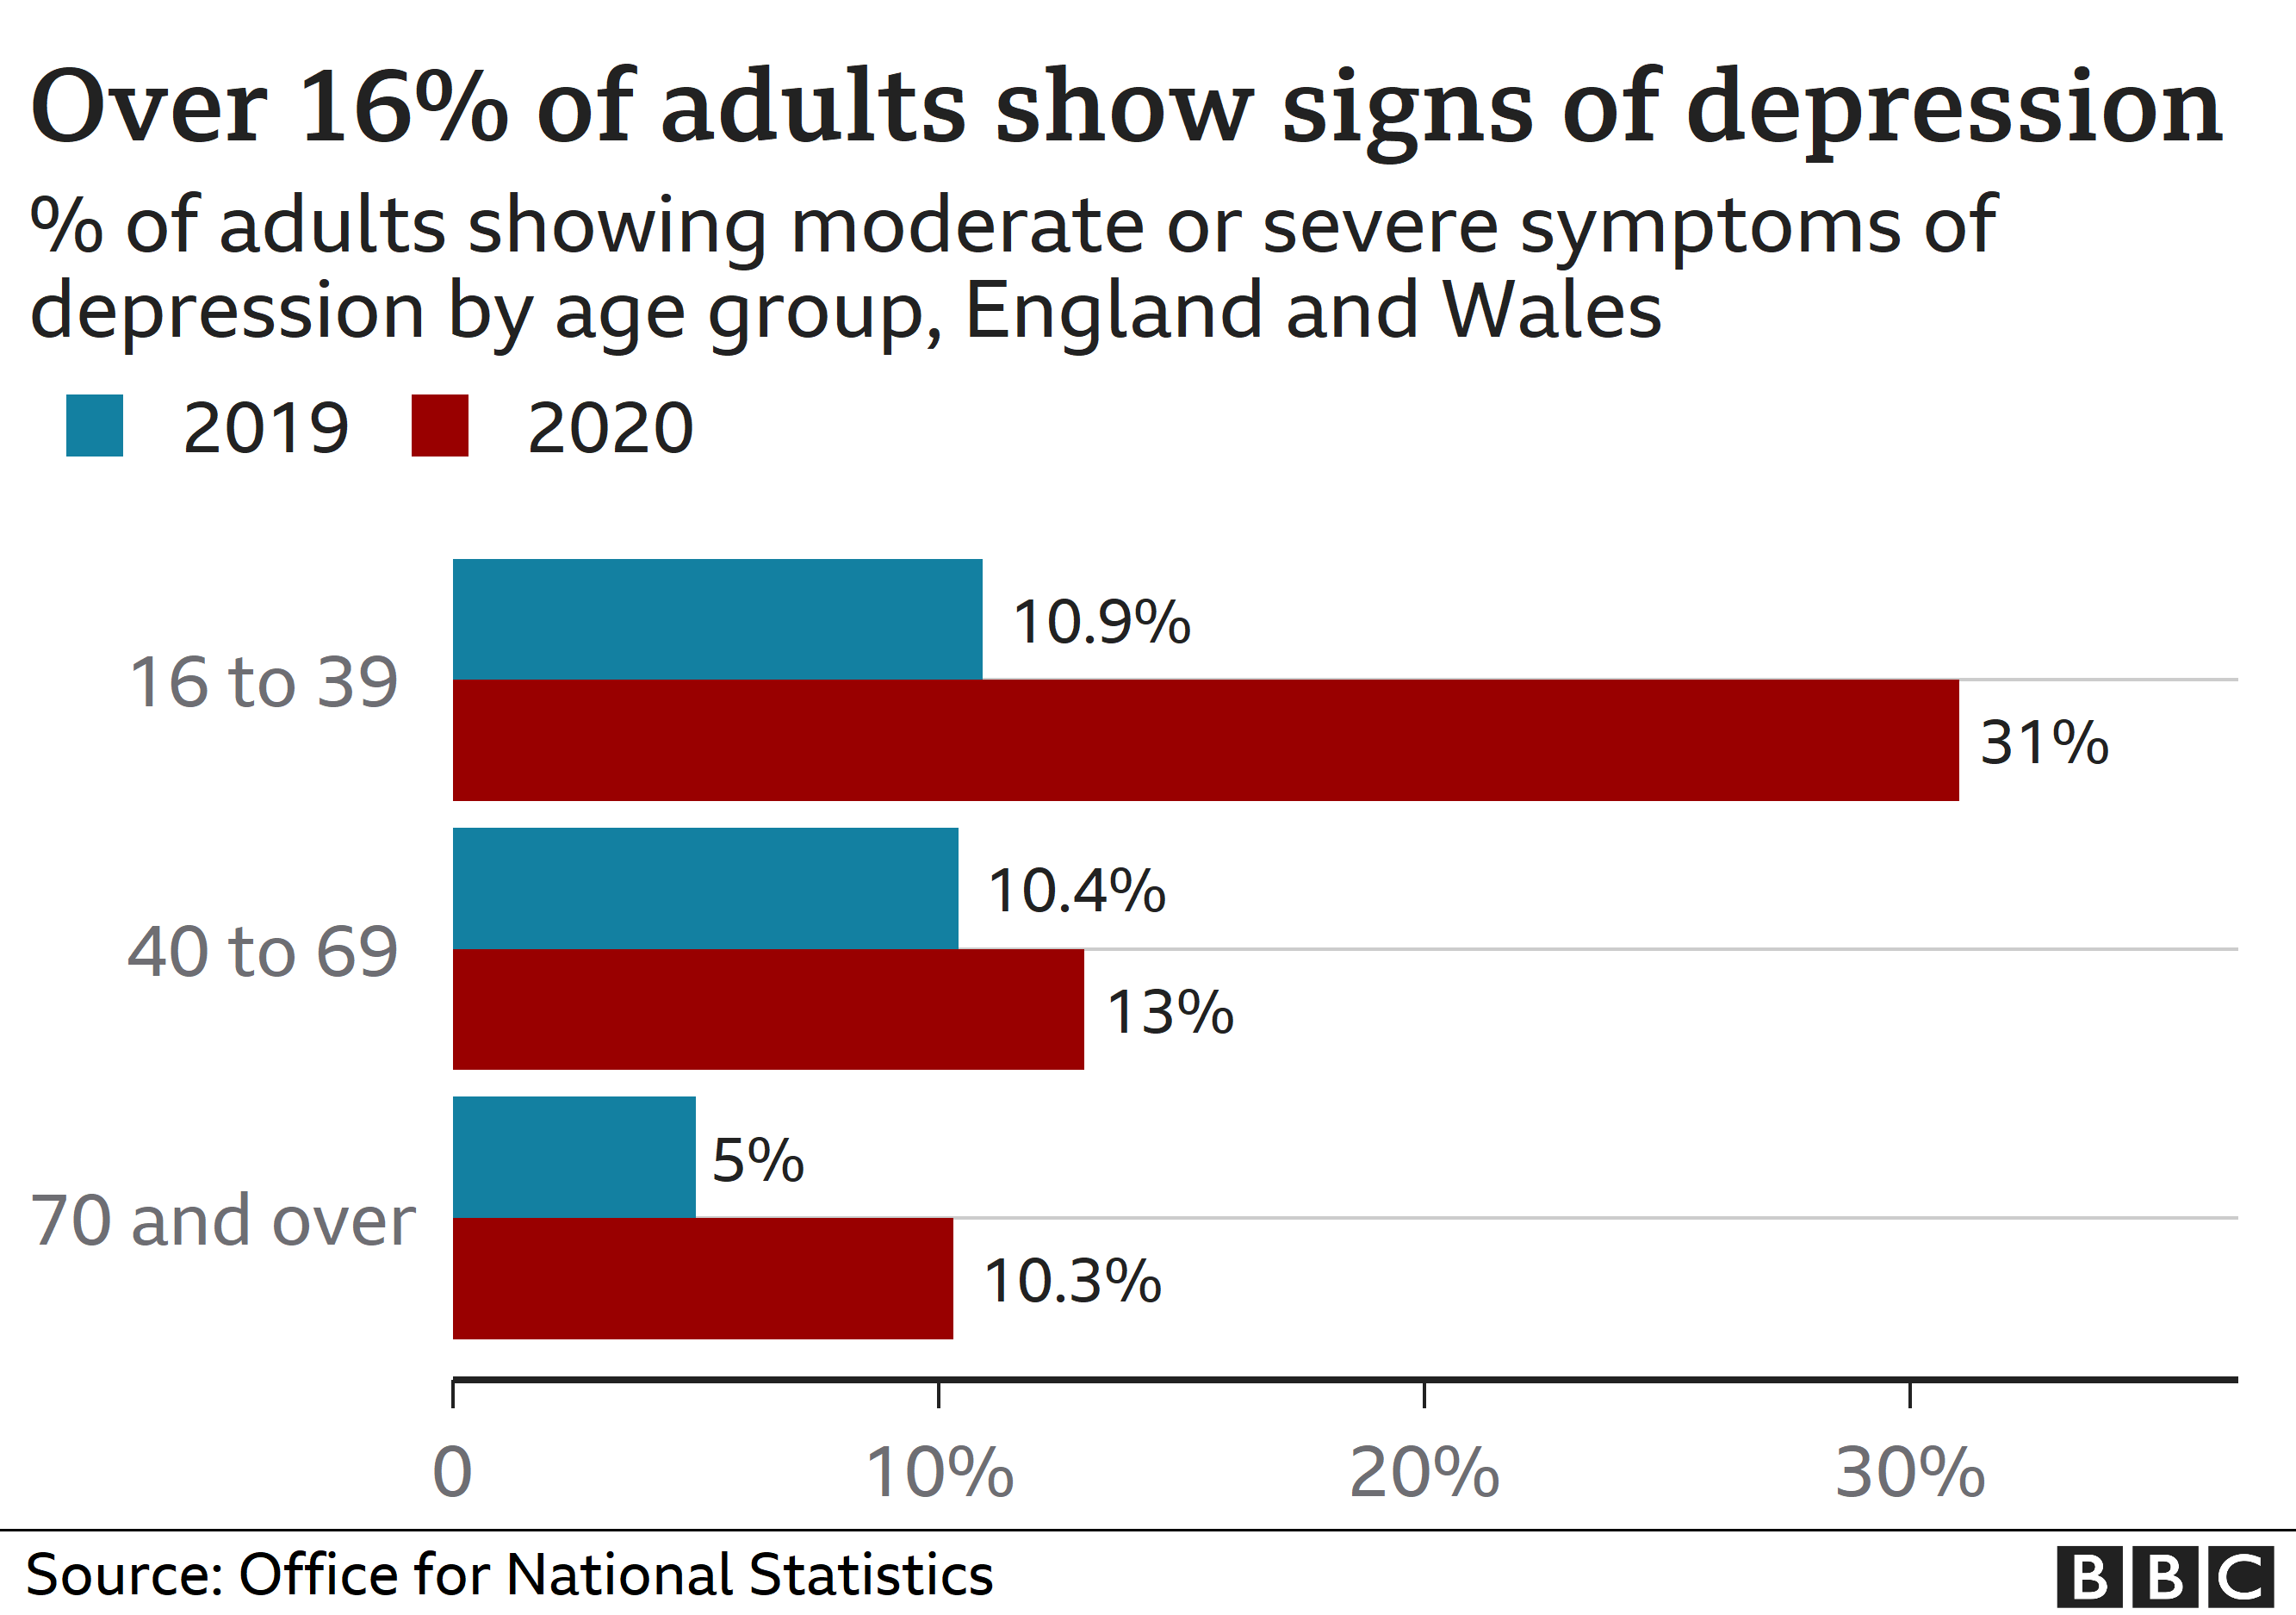
Good mental health is vital for children and young people to flourish, but NHS research suggests that during the pandemic it has worsened in England.
Both boys and girls were affected, suggesting the uncertainty, loneliness and disruption of this year have taken their toll.
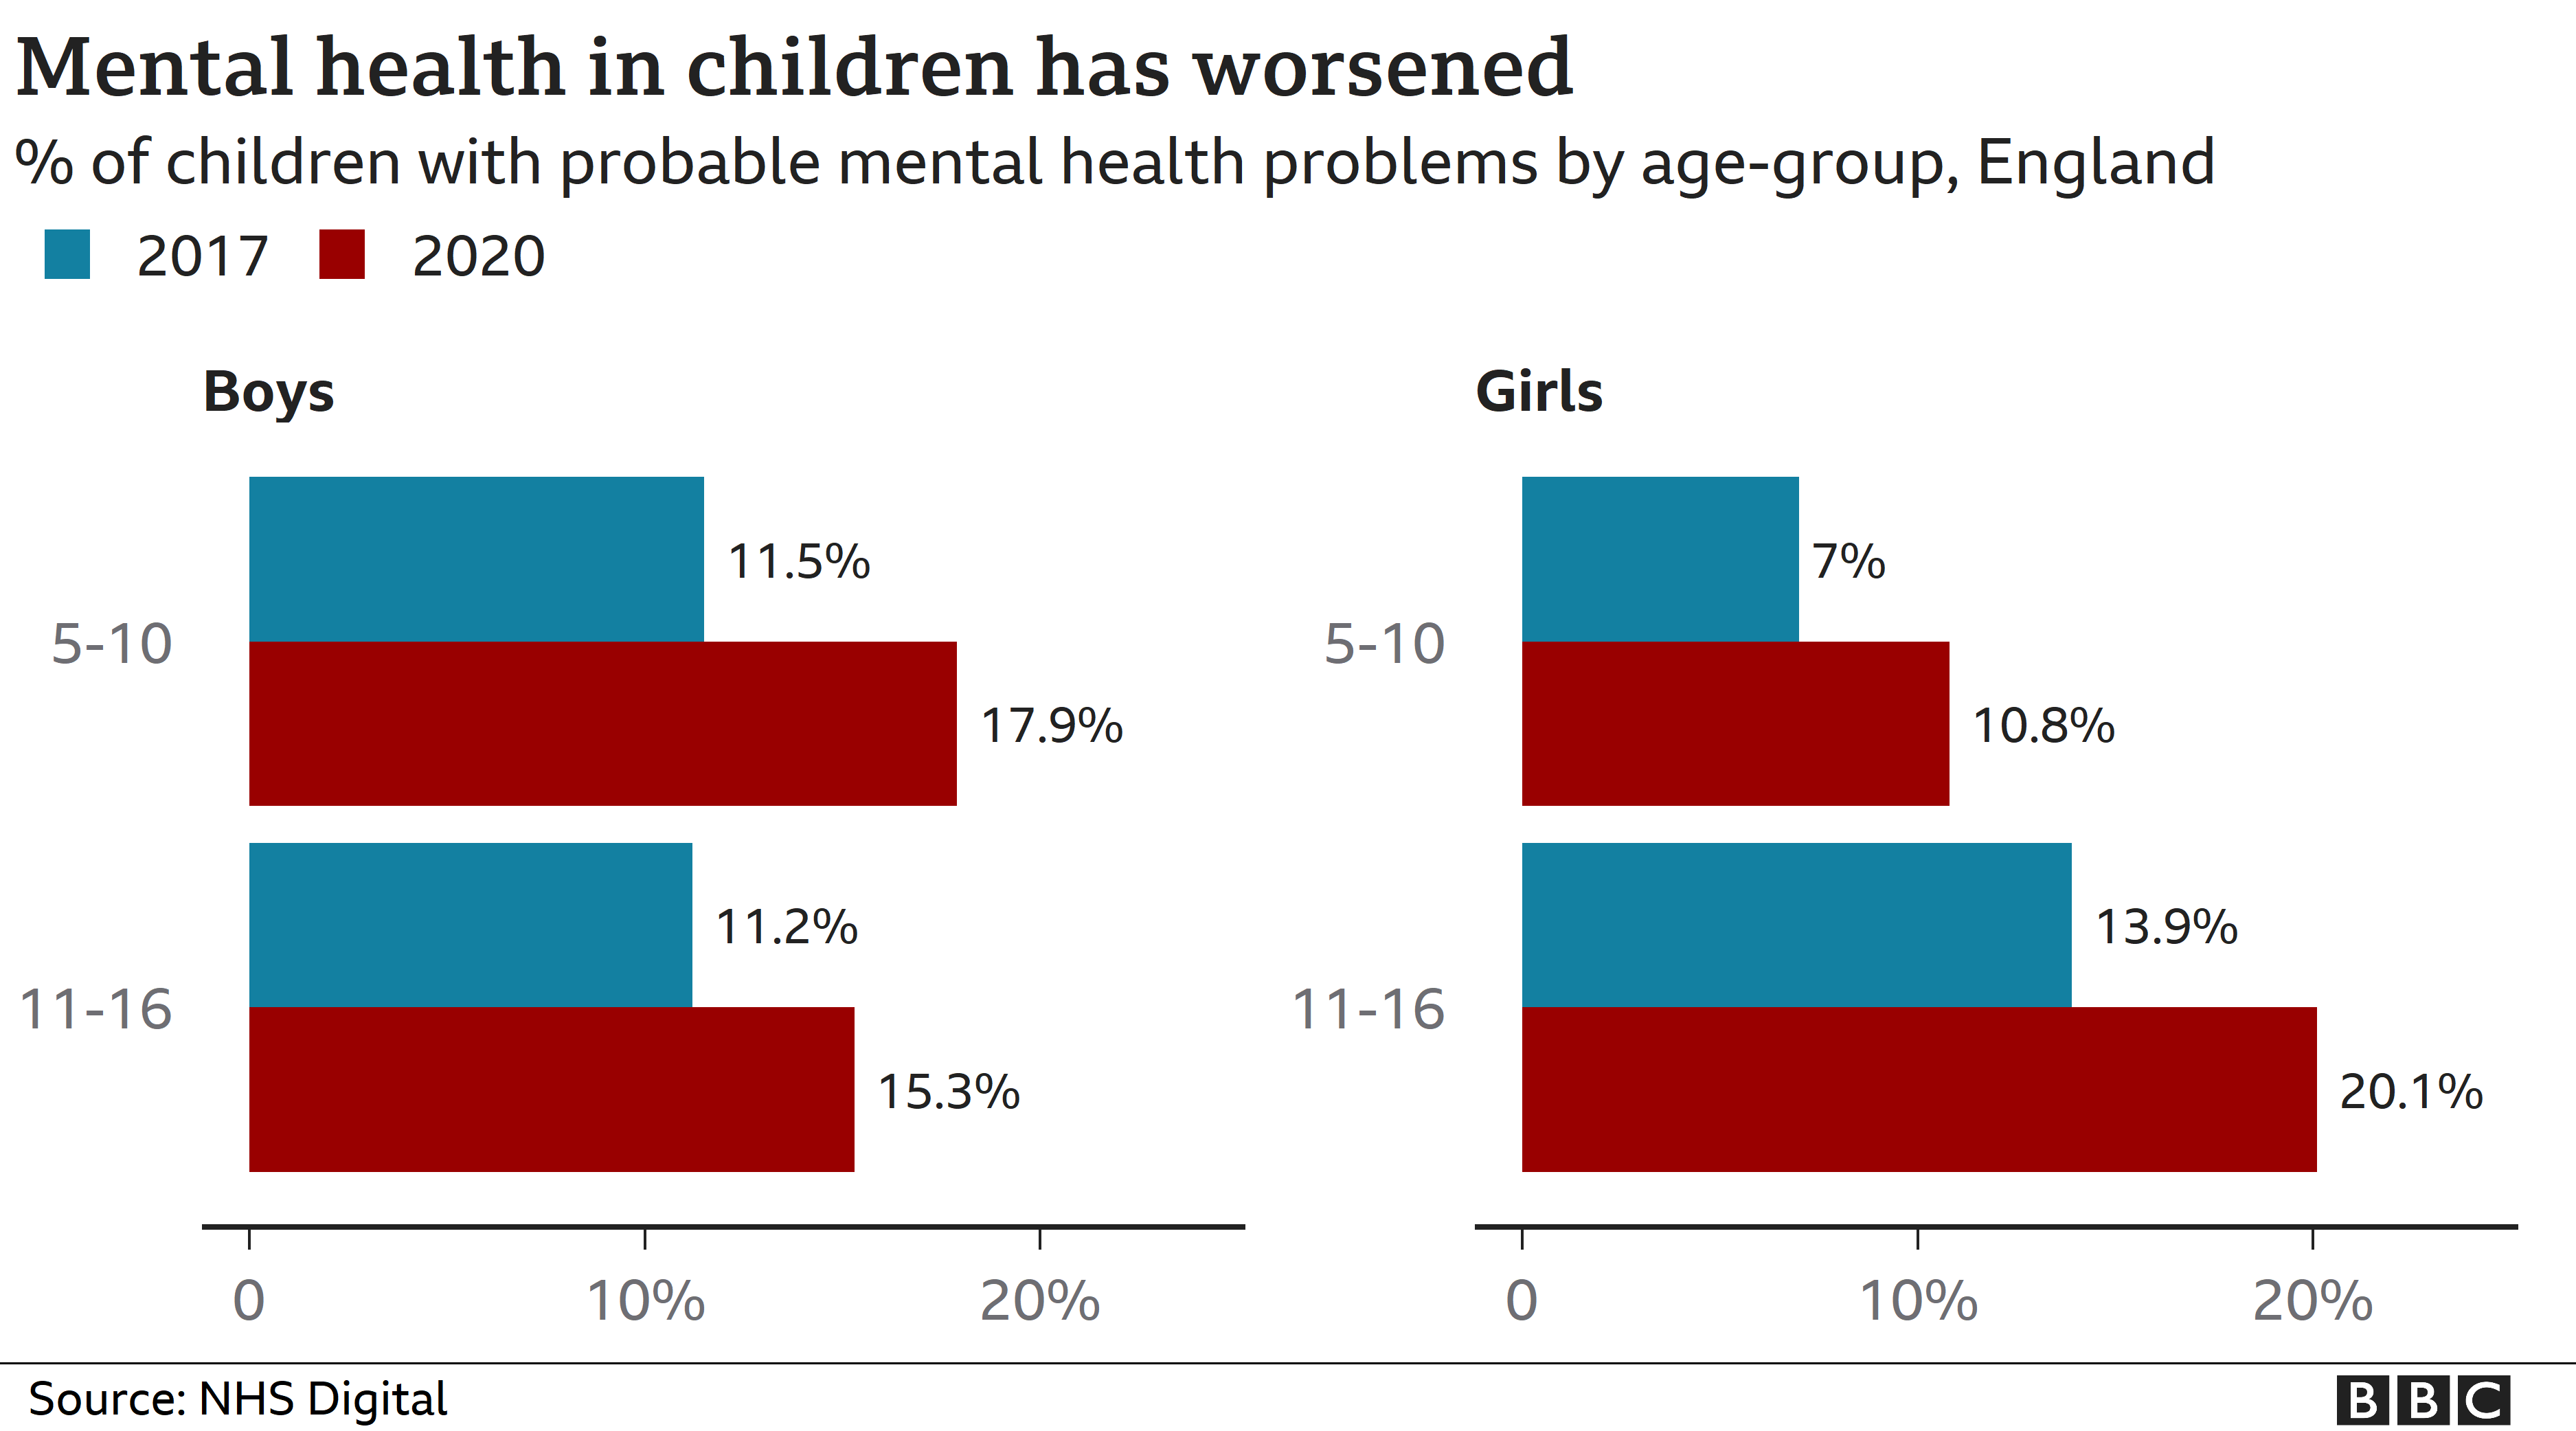
The pressure on families worried about their finances, forced to spend time together in lockdown appear to be a factor. Teenage girls reporting mental health difficulties are more likely to have seen an argument at home.
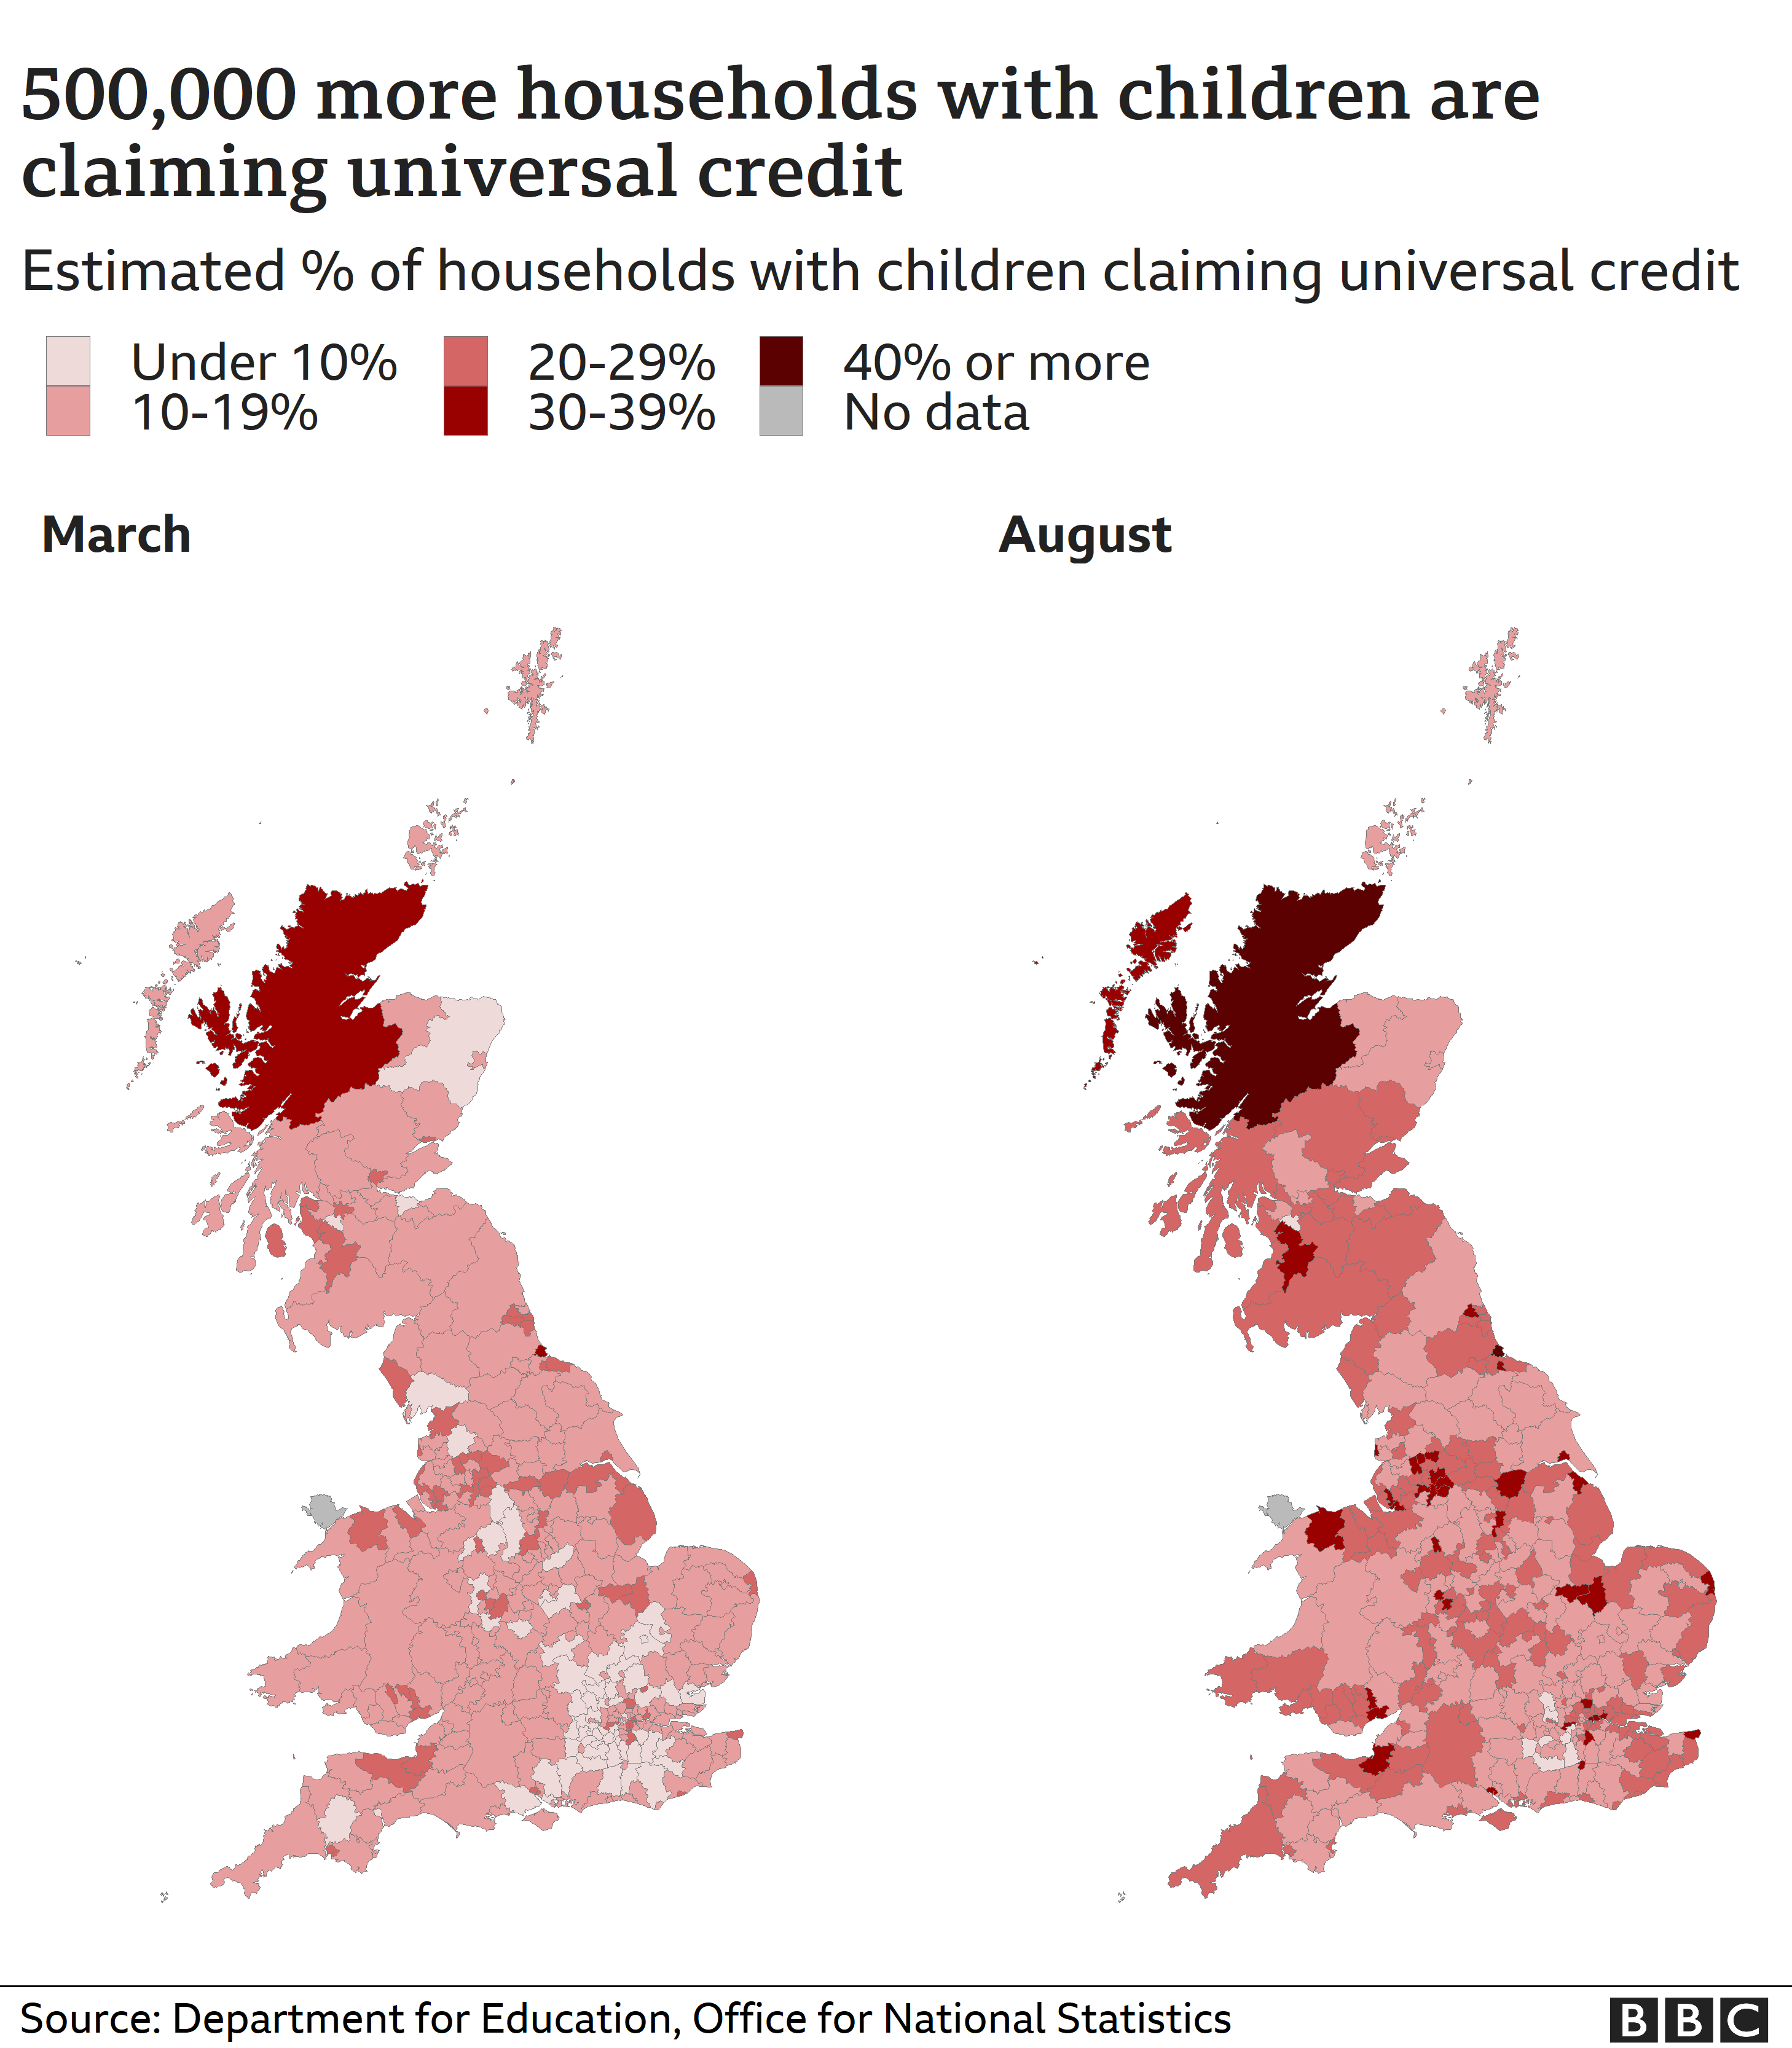
More than half a million additional households with children are claiming universal credit than at the pandemic’s start, which is a marker of increased child poverty risks.
Schools are reporting a big increase in parents seeking free school meals for their children, although official statistics will not be available until next year.
Food poverty and the corrosive impact on children’s lives has galvanised schools to organise food banks and grocery deliveries for families in their communities.
The shame and stigma around children’s hunger has been softened by the high-profile campaigning by footballer Marcus Rashford.
The concern led to government support in the form of extending holiday free school meals, extra payments to families living in poverty, or money to local authorities.
- Who will get free school meals?
- How many children need free meals?
Poverty and welfare: More people claiming benefits

The welfare system has seen unprecedented demands this year, and 5.7 million people are now receiving the main benefit, universal credit. This figure has almost doubled since March.
It has coped admirably with the surge in claimants, including handling 1.5 million applications over a four-week period to 9 April.
- What is universal credit and what else can I claim?
- Can I go on furlough and how much will I be paid?
It hasn’t just processed those claims, it has also increased the speed and accuracy of payments to claimants, and there is understandable pride within the Department for Work and Pensions at what they’ve achieved.
In total, around 6.3% of people in the UK are claiming unemployment welfare, with fears that this will increase moving forward.
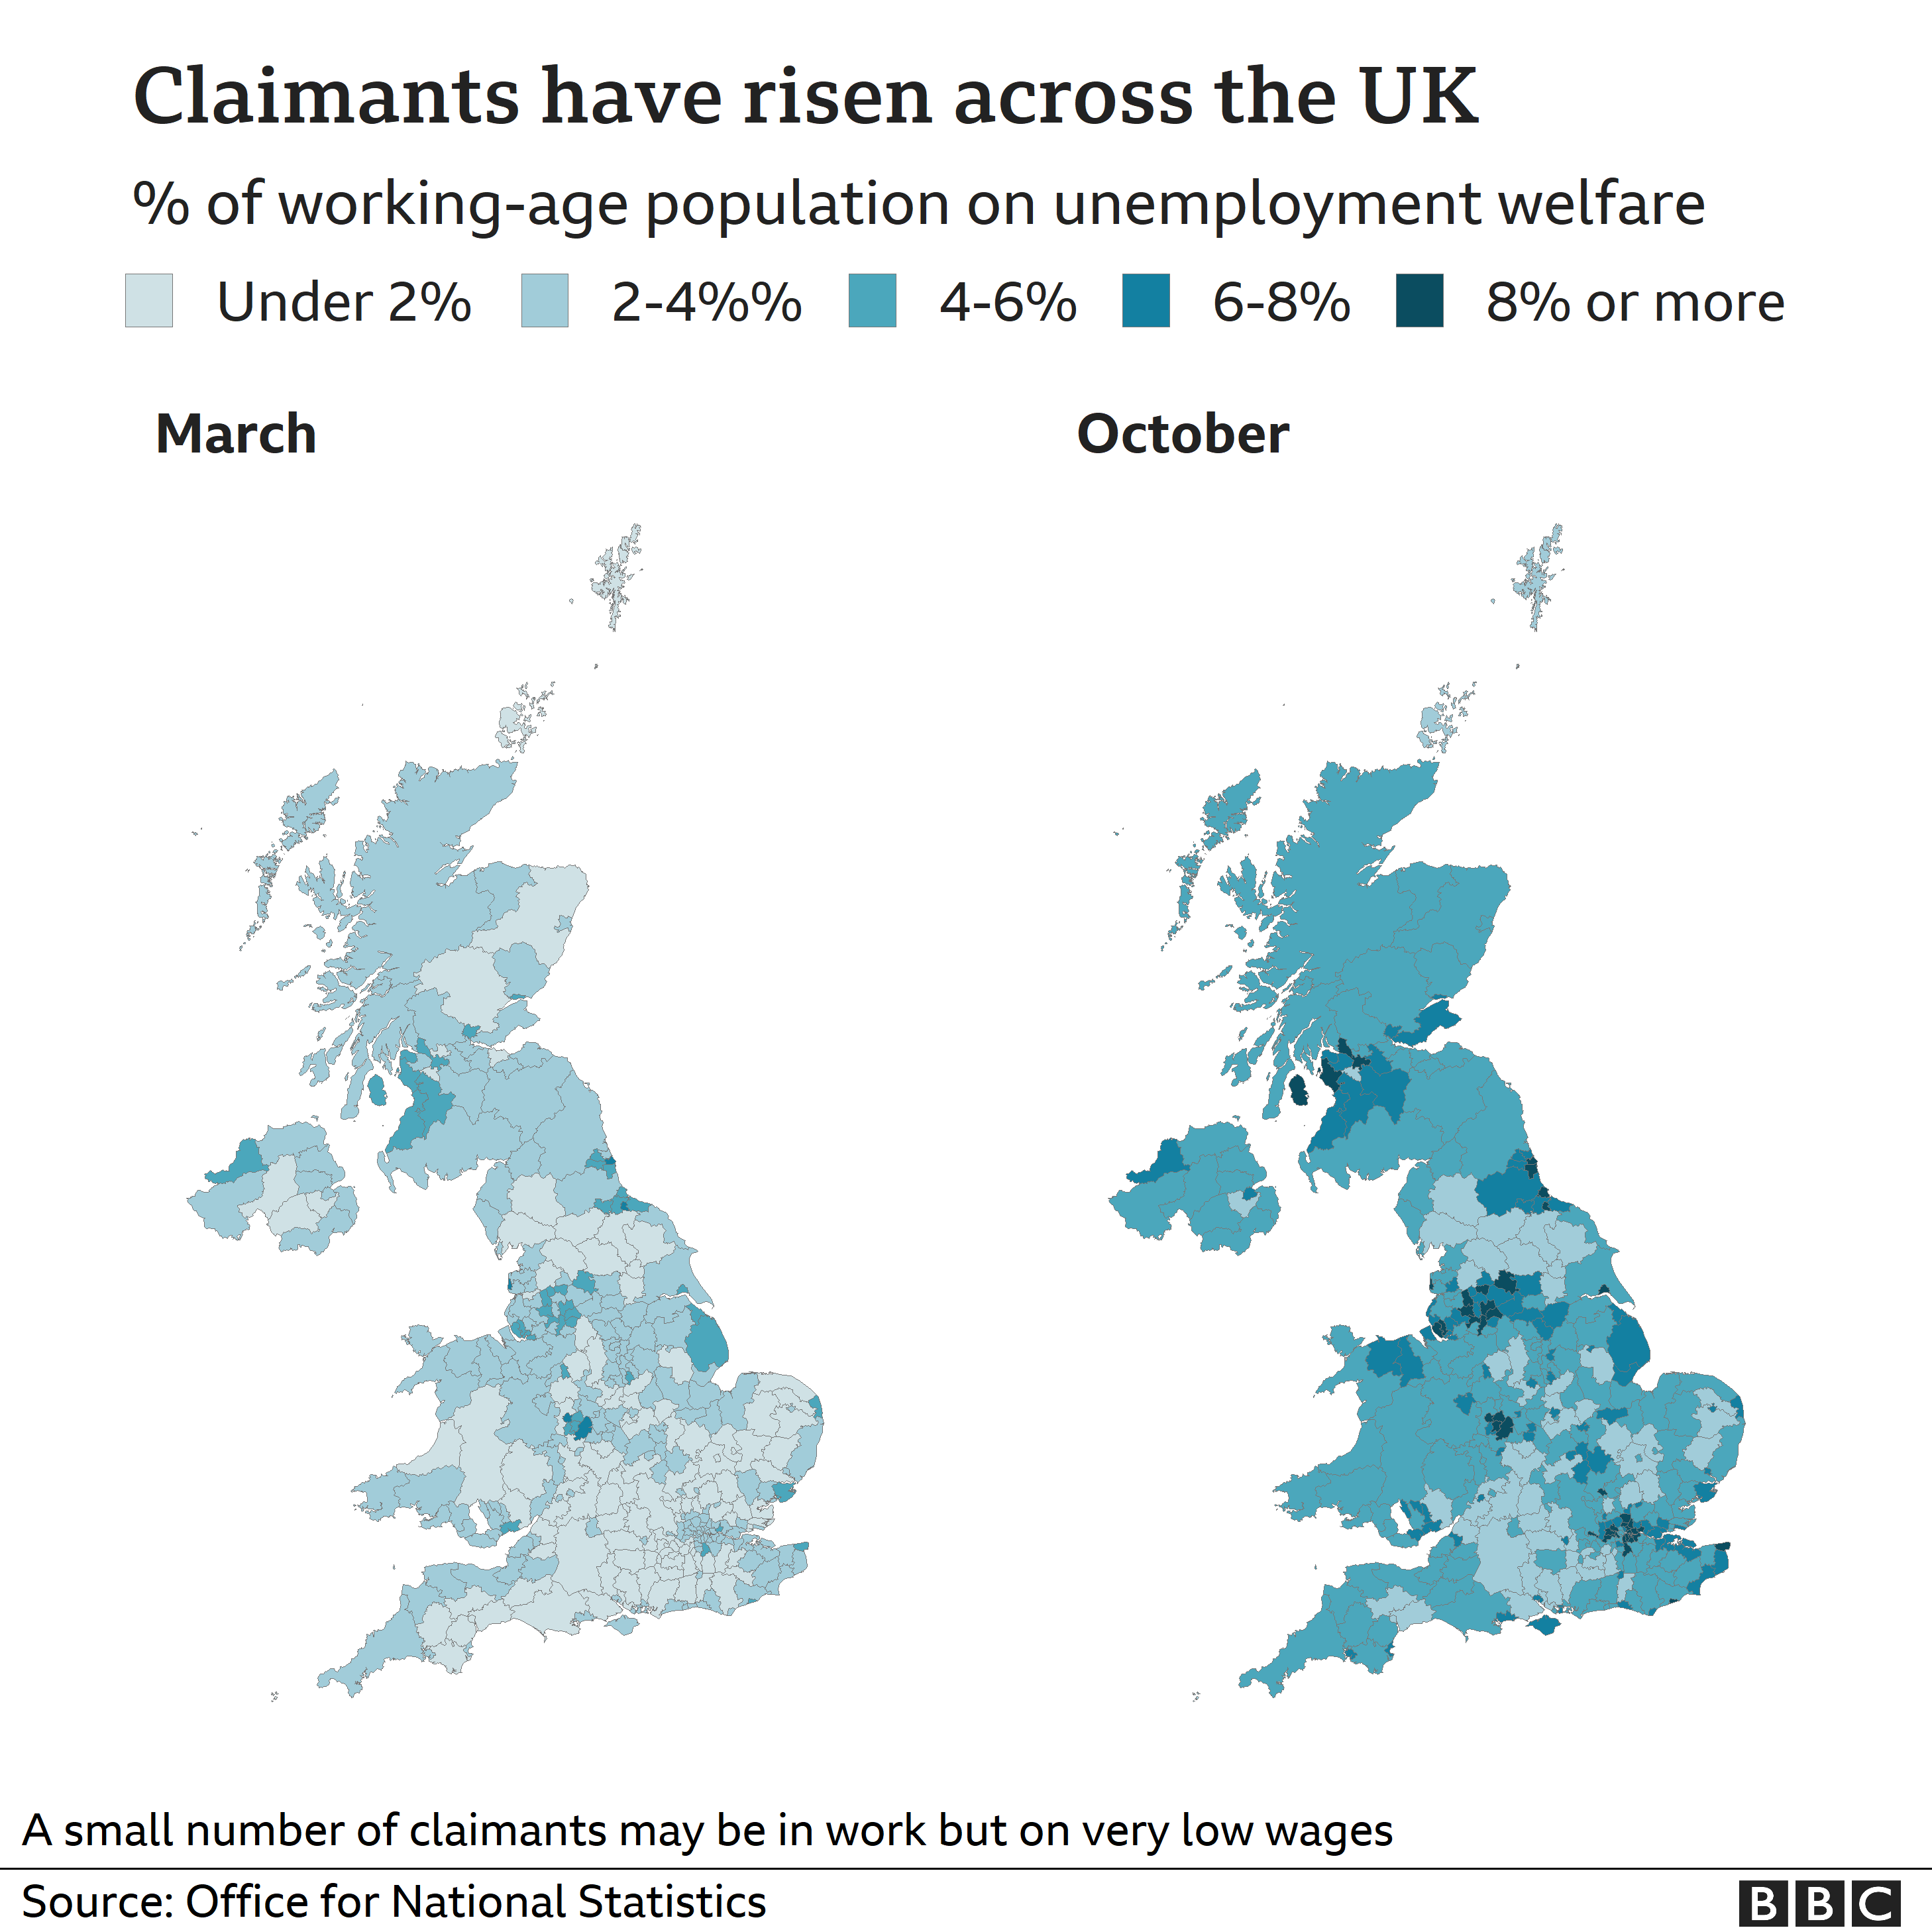
The largest proportion of people on unemployment benefits remain in areas like the north of England, south Wales and central Scotland. But the pandemic has forced people elsewhere who had never previously needed benefits, to turn to the welfare state.
The largest increase in claimants has been in the south of England, which is partly explained by so few claiming unemployment welfare before, making any increases particularly noticeable.
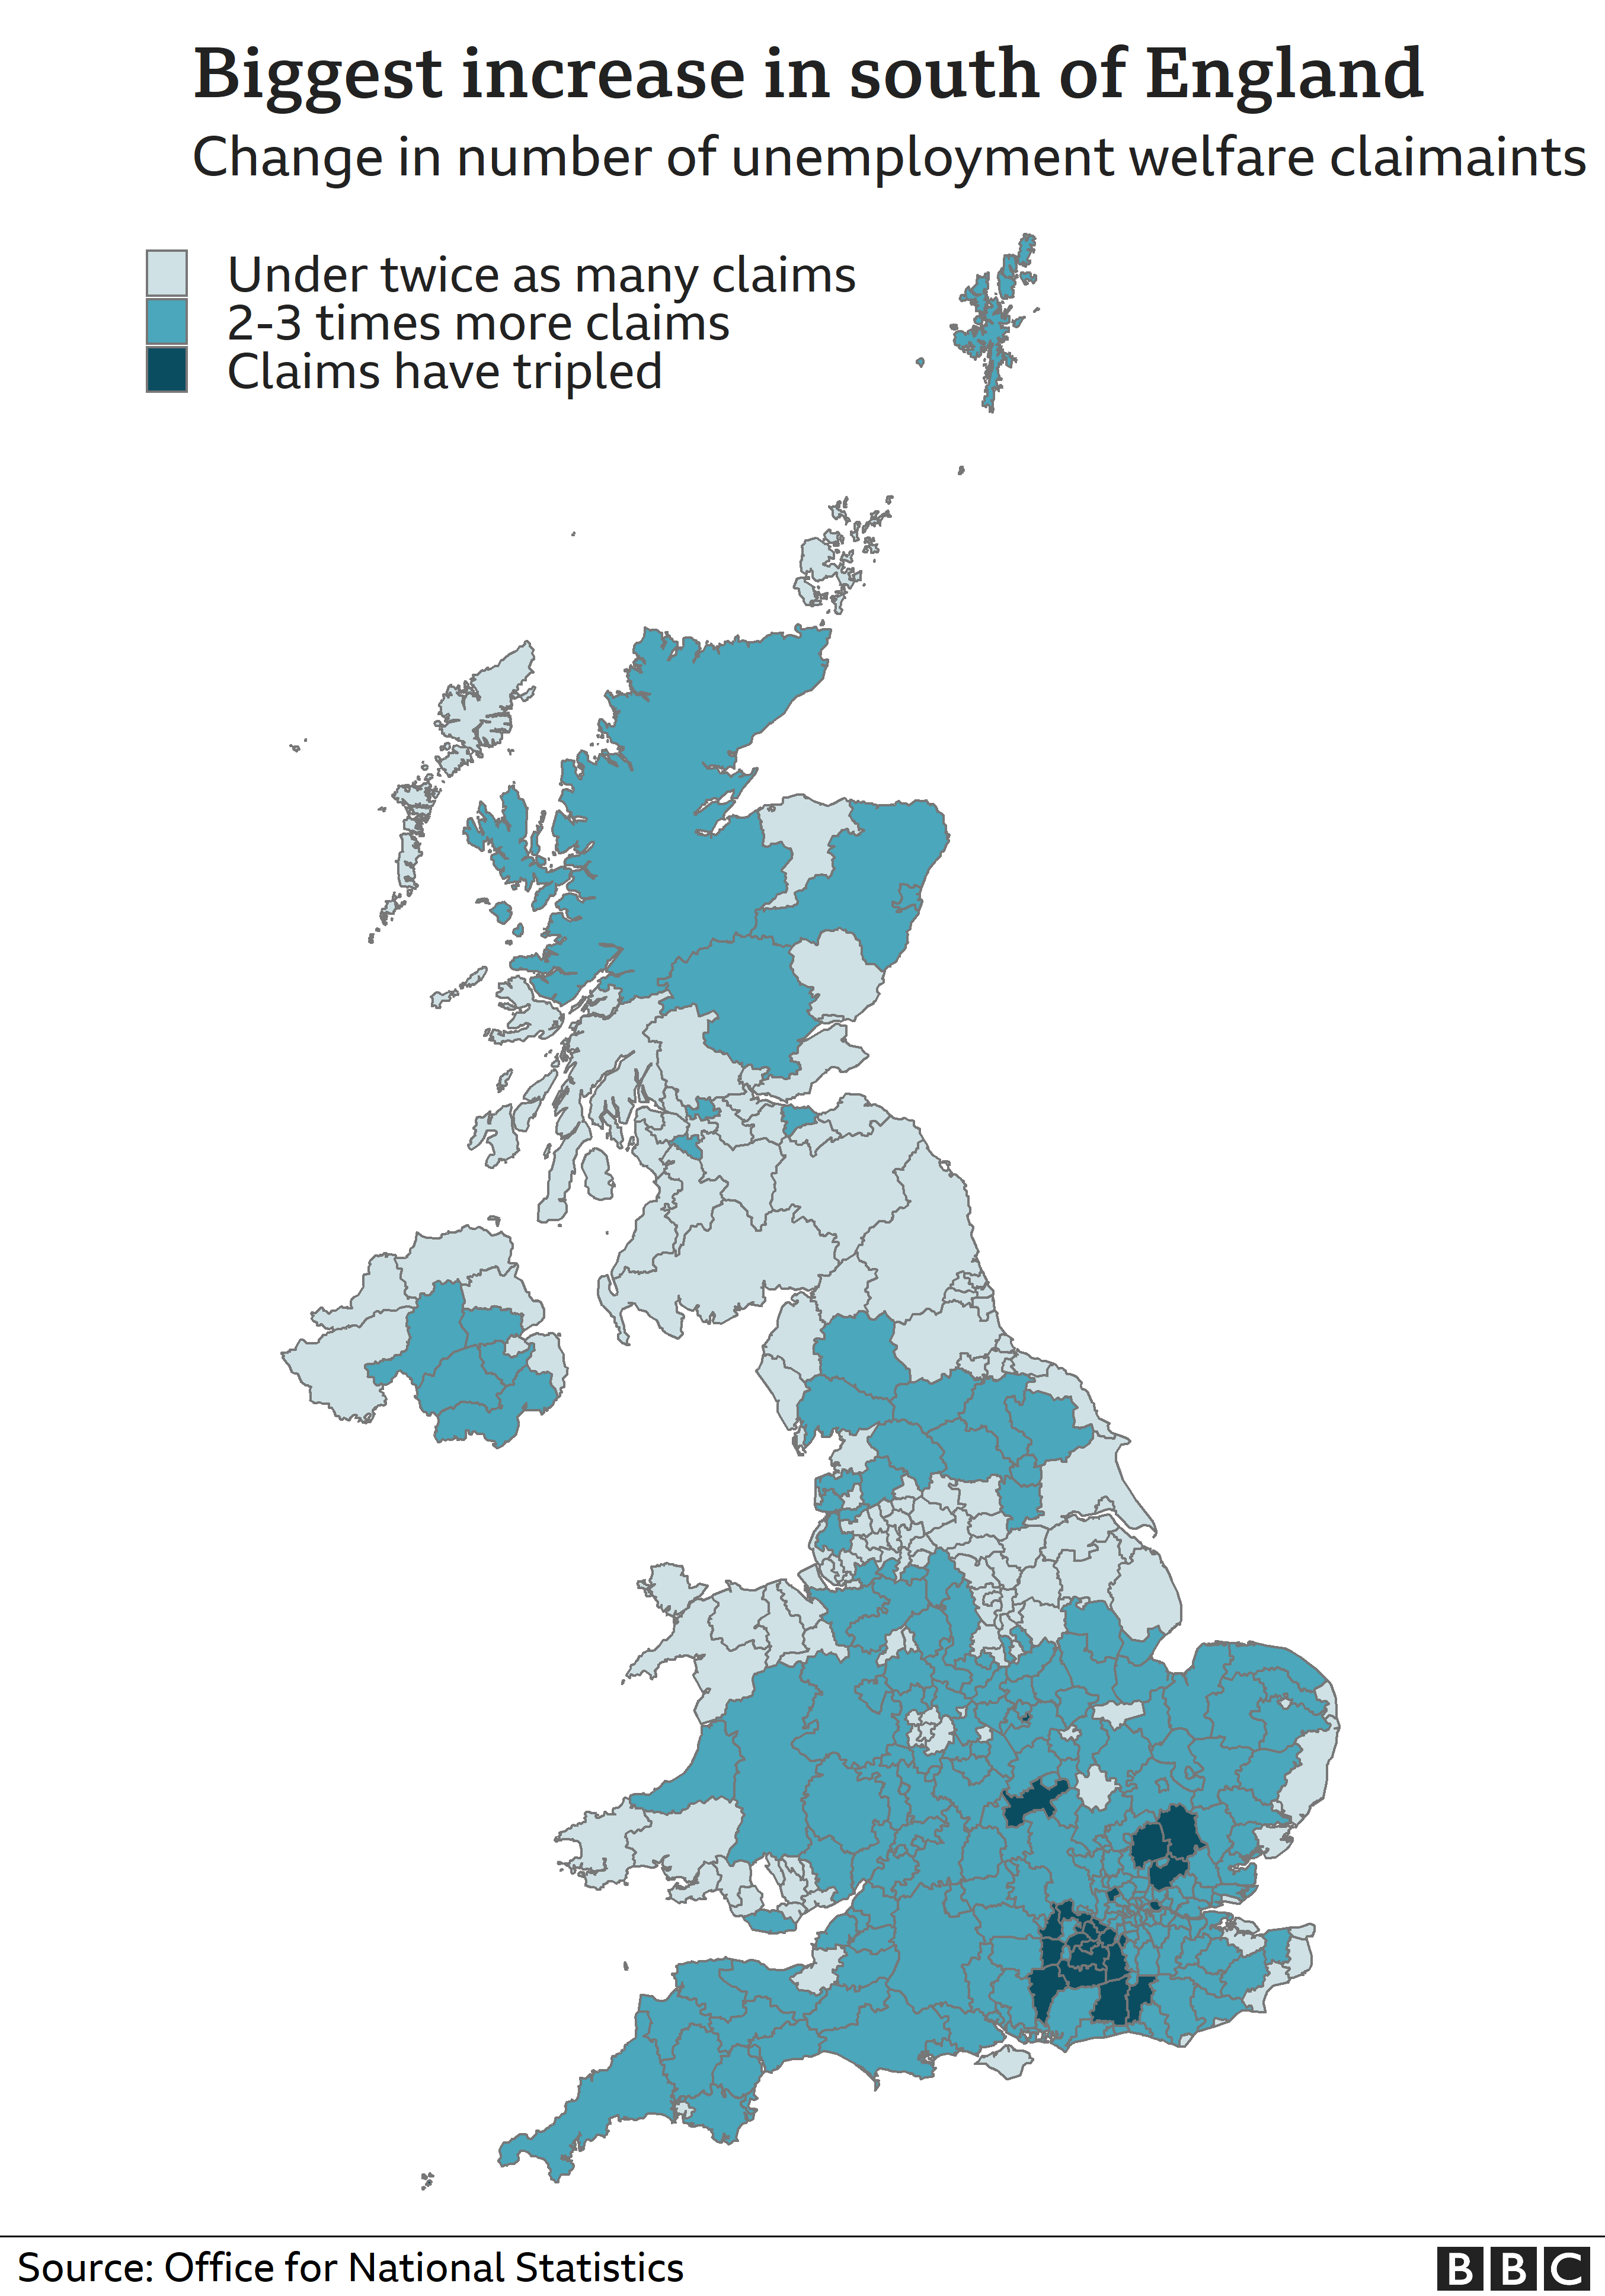
When large-scale working from home started. the cleaners, coffee shops, tailors, and dry cleaners used by London’s office workers had no work and needed help, through welfare or the furlough scheme.
The collapse of the aviation sector saw Gatwick’s workforce lose jobs and money. Add in towns with a strong retail economy, like Guildford, and you can see how coronavirus has wreaked economic havoc in the region.
As with children, studies have shown that mental health amongst adults has worsened considerably during 2020, according to the Office for National Statistics.
Production, data and visualisations by Ben Butcher.
Published at Tue, 15 Dec 2020 01:24:51 +0000


Comments
Loading…